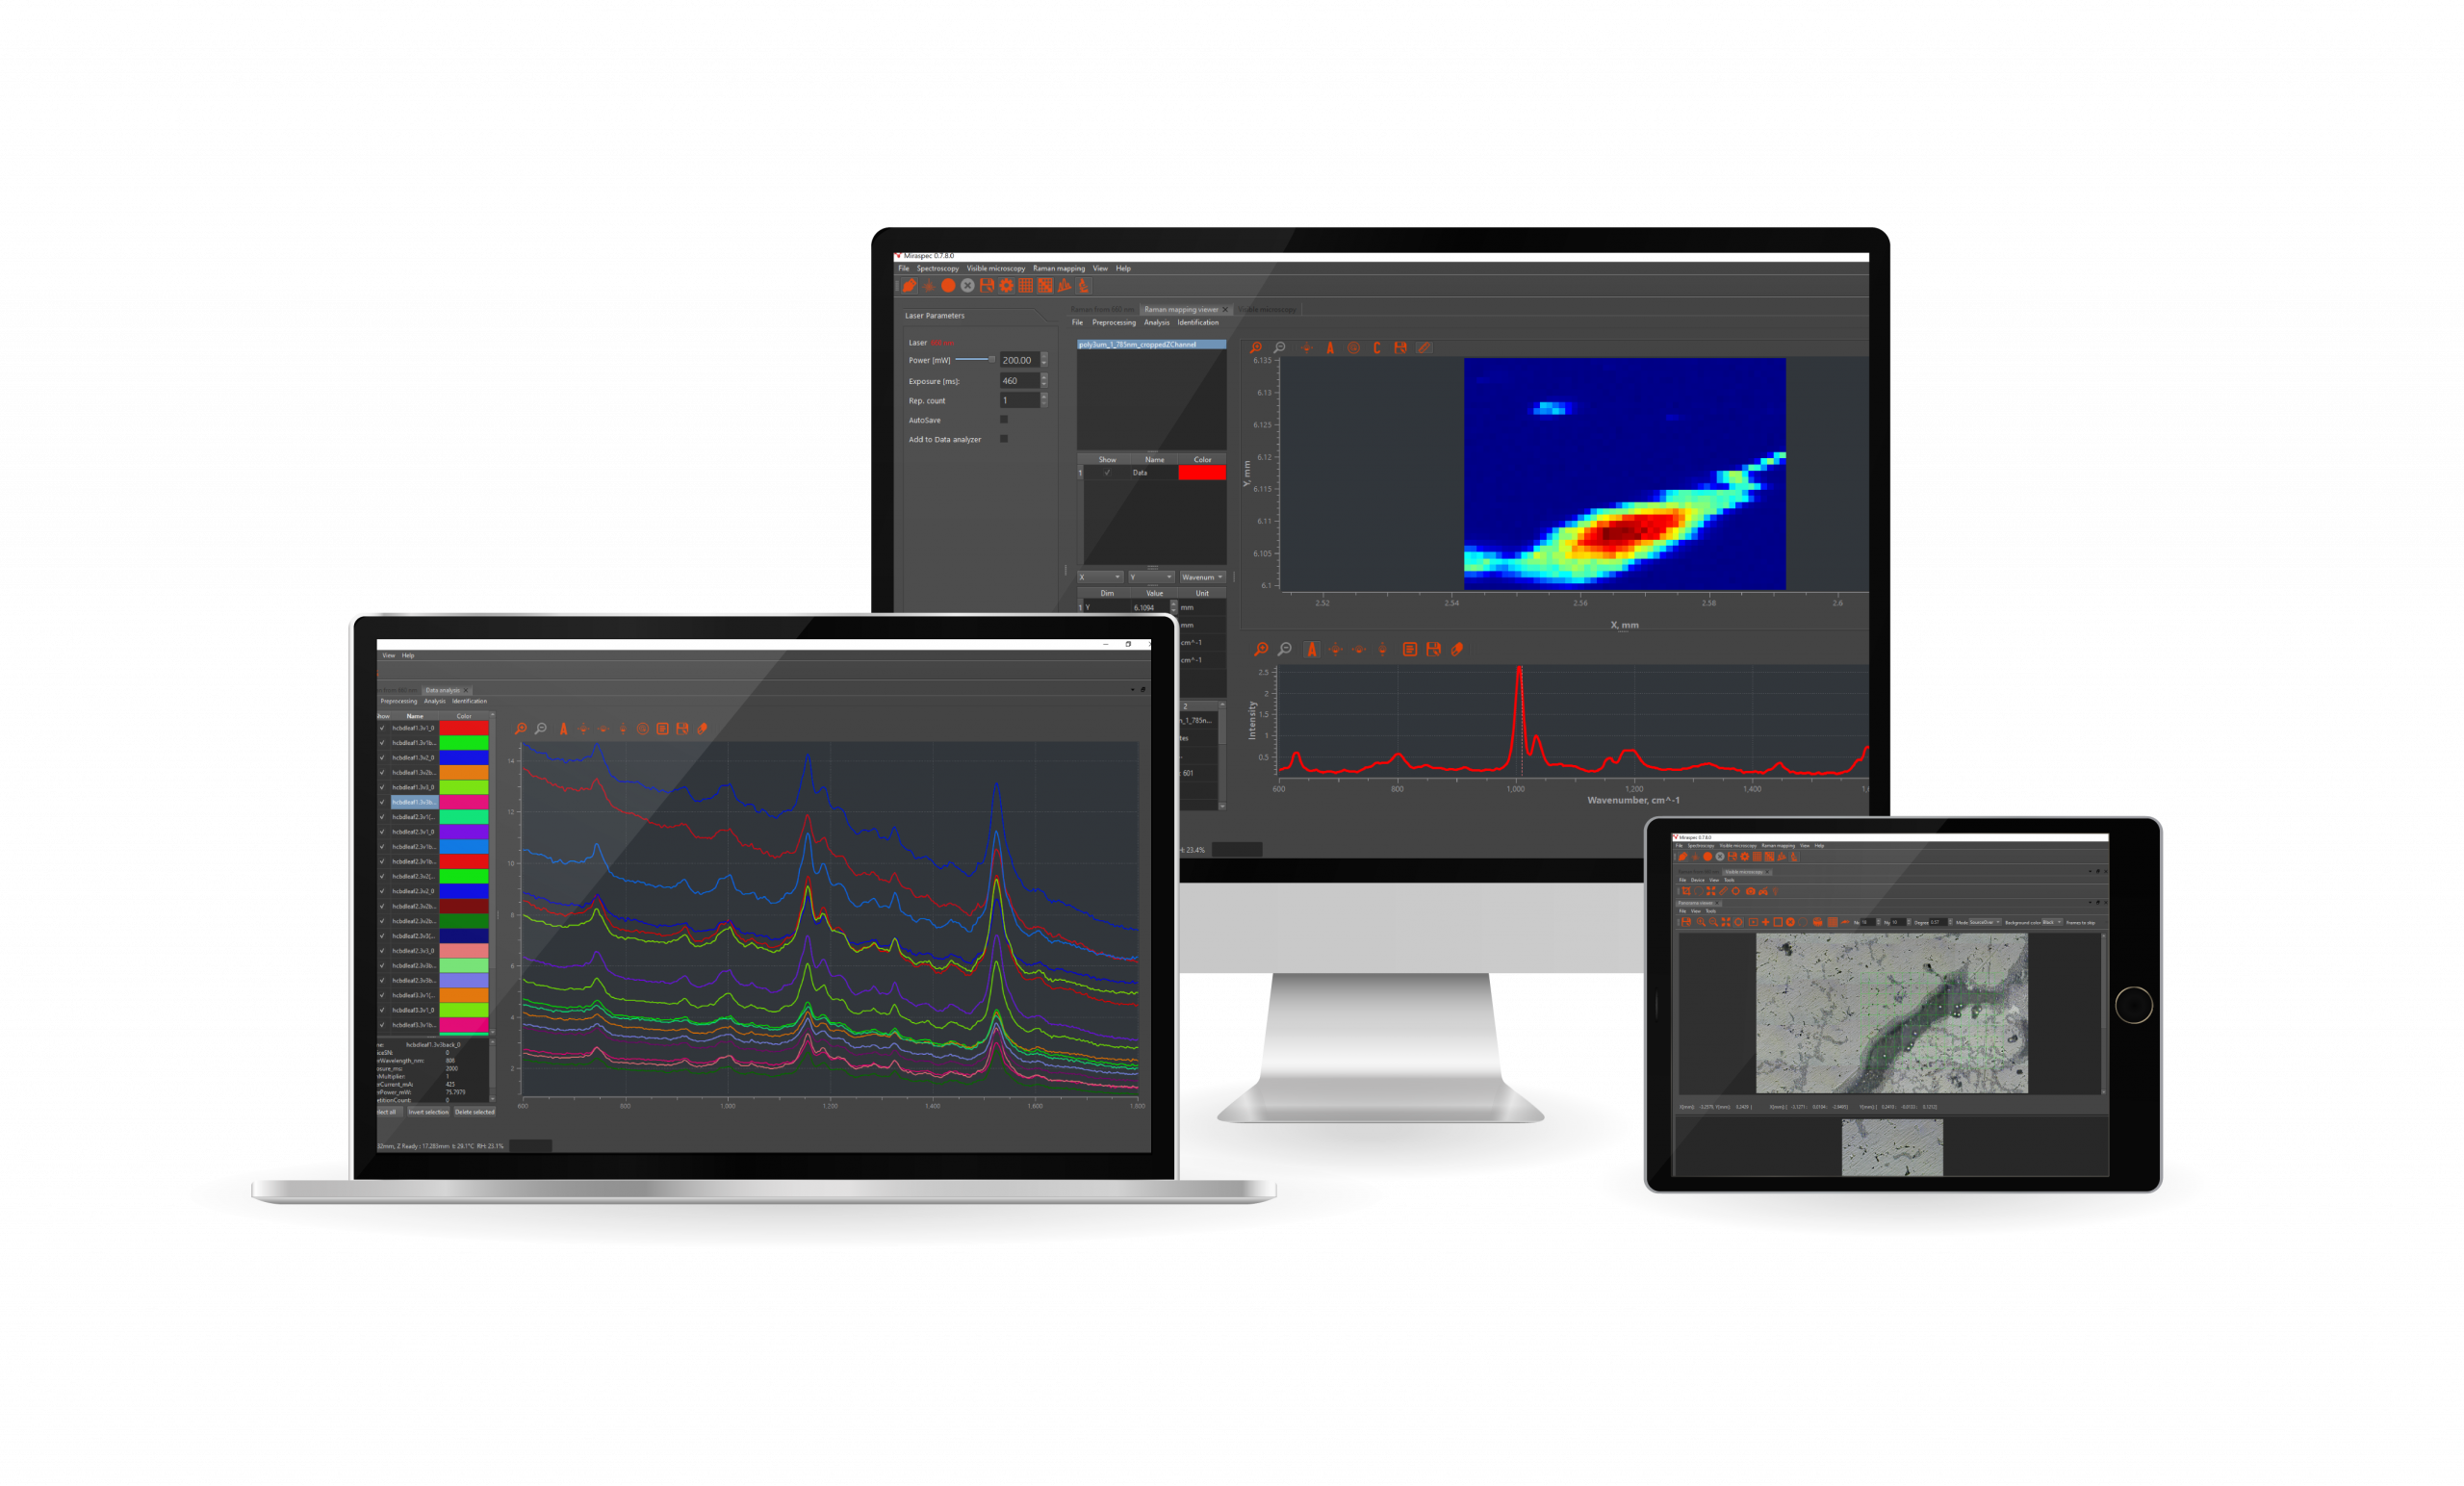
Miraspec™
A Lightnovo Software platform
Miraspec for Spectrometers Miraspec for Spectrometers Miraspec for Spectrometers
Software for PC (Windows 10, 11) and smartphone (Android)
*patented feature
System controlled by smartphone or PC via Bluetooth or USB-C cable.
Data format
Export data in the following formats: tsv, txt and jdx
Data Preprocessing
Spike correction
(Whitaker-Hayes, moving window)
Spectral smoothing
(Whittaker, asymmetric least squares, Savitzky-Golay)
Baseline correction
(rolling circle, rubberband, least squares, asymmetrically reweighted penalized)
Spectrum normalization
(Z-score, mean, Mean centre, MinMax, Unit Norm L1, Unit Norm L2)
Intensity normalization*
Laser mode-hop correction*
Spectral super resolution*
Data Exploration
Principal component analysis
Non-negative matrix factorization (SIMPLISMA-NNLS, MCR-ALS)
Qualitative Analysis
Material identification
(Pearson correlation, square Euclidean cosine, square first difference Euclidean cosine)
Creation of spectral libraries
Data Acquisition
Laser power control
Exposure time control
Sensor gain control
Number of repetitions control
Spectral range control
Quantitative Analysis
Principal component regression
Creation of spectral libraries
Raman peak height/peak area calibration
Partial Least Squares (PLS) calibration
Classification
Random Forest, Linear SVM, AdaBoost, Decision Tree, Hoefding Tree, Naïve Bayes, Perceptron, Softmax Regression
Miraspec for Microscope Miraspec for Microscope Miraspec for Microscope
Software for PC (Windows 10, 11) and smartphone (Android)
*patented feature
System controlled by smartphone or PC via Bluetooth or USB-C cable.
Data format
Export data in the following formats: tsv, txt and jdx
Data Preprocessing
Spike correction
(Whitaker-Hayes, moving window)
Spectral smoothing
(Whittaker, asymmetric least squares, Savitzky-Golay)
Baseline correction
(rolling circle, rubberband, least squares, asymmetrically reweighted penalized)
Spectrum normalization
(Z-score, mean, Mean centre, MinMax, Unit Norm L1, Unit Norm L2)
Intensity normalization*
Laser mode-hop correction*
Spectral super resolution*
Mapping
X, Y and/or Z spatial mapping
Time mapping
Curvature compensation
Map Analysis
Peak intensity map using 2 dimensions (X, Y, Z, time or Raman shift)
Peak area map using 2 dimensions (X, Y, Z, time or Raman shift)
Data Acquisition
Laser power control
Exposure time control
Sensor gain control
Number of repetitions control
Spectral range control
Chemical Mapping Methods
Principal component regression
Non-negative matrix factorization (SIMPLISMA-NNLS, MCR-ALS)
Visual Microscopy
Simultaneous image acquisition
Visualization of laser spot position
Panorama sample imaging
Download Miraspec Download Miraspec Download Miraspec
Download Miraspec Software for PC (Windows 10, 11) and smartphone (Android):
![]() Portable version of Miraspec is a zip archive which can be unpacked into arbitrary non-system folder of a Windows PC
Portable version of Miraspec is a zip archive which can be unpacked into arbitrary non-system folder of a Windows PC
and can be used without administrator privileges.
![]() Portable version of Miraspec is a zip archive which can be unpacked into arbitrary non-system folder of a Windows PC
Portable version of Miraspec is a zip archive which can be unpacked into arbitrary non-system folder of a Windows PC
and can be used without administrator privileges.
![]() This version of Miraspec is a Windows installer file, it requires administrator privileges on a PC
This version of Miraspec is a Windows installer file, it requires administrator privileges on a PC
in order to install and run it properly.
Android application allows to control miniRaman spectrometers from an Android phone or tablet.![]()
This is a legacy version of miniRaman software for 64-bit Windows systems.![]()
![]() This is a legacy version of miniRaman software for 32-bit Windows systems.
This is a legacy version of miniRaman software for 32-bit Windows systems.
Applications
miniRaman / RG Spectrometers miniRaman / RG Spectrometers miniRaman / RG Spectrometers
Data Acquisition
- Laser power control
- Expose time control
- Sensor gain control
- Number of repetitions control
- Spectral range control
Data Preprocessing
- Spectral smoothing using Savitzky-Golay filter and Asymmetric Least Squares
- Spectral background correction using rolling circle and Asymmetric Least Squares
- Spectrum normalization (unit norm, unit area)
- Intensity normalization*
- Laser mode-hop correction*
- Spectral super resolution*
*Patented Feature
Data Analysis
Qualitative Analysis
- Materials identification
- Creation of spectral libraries
- PCA and MCR decomposition
Quantitative Analysis
- Raman peak height/peak area calibration
- Partial Least Squares (PLS) calibration
- Non-Negative Least Squares quantification of mixtures
Data Acquisition
- See white light microscopy image simultaneously with the laser spot on the sample
- Navigate over the microscopy image with XYZ sample manipulation
- Set up Raman mapping parameters (mapping area, step size, exposure time, laser power, etc.)
- Measure the Raman map with required dimensions in X, Y, Z
- Set up kinetic mapping
- Avoid surface morphology impact on the Raman spectrum quality during mapping under high NA microscope objective – sample surface curvature compensation
Data Analysis
- Represent Raman map at peak intensity, peak area with and without background correction
- Create Raman spectral library from the Raman map
- Decompose Raman map into the chemical map using PCA, MCR and NNLS
Applications
miniRaman / RG Microscope miniRaman / RG Microscope miniRaman / RG Microscope