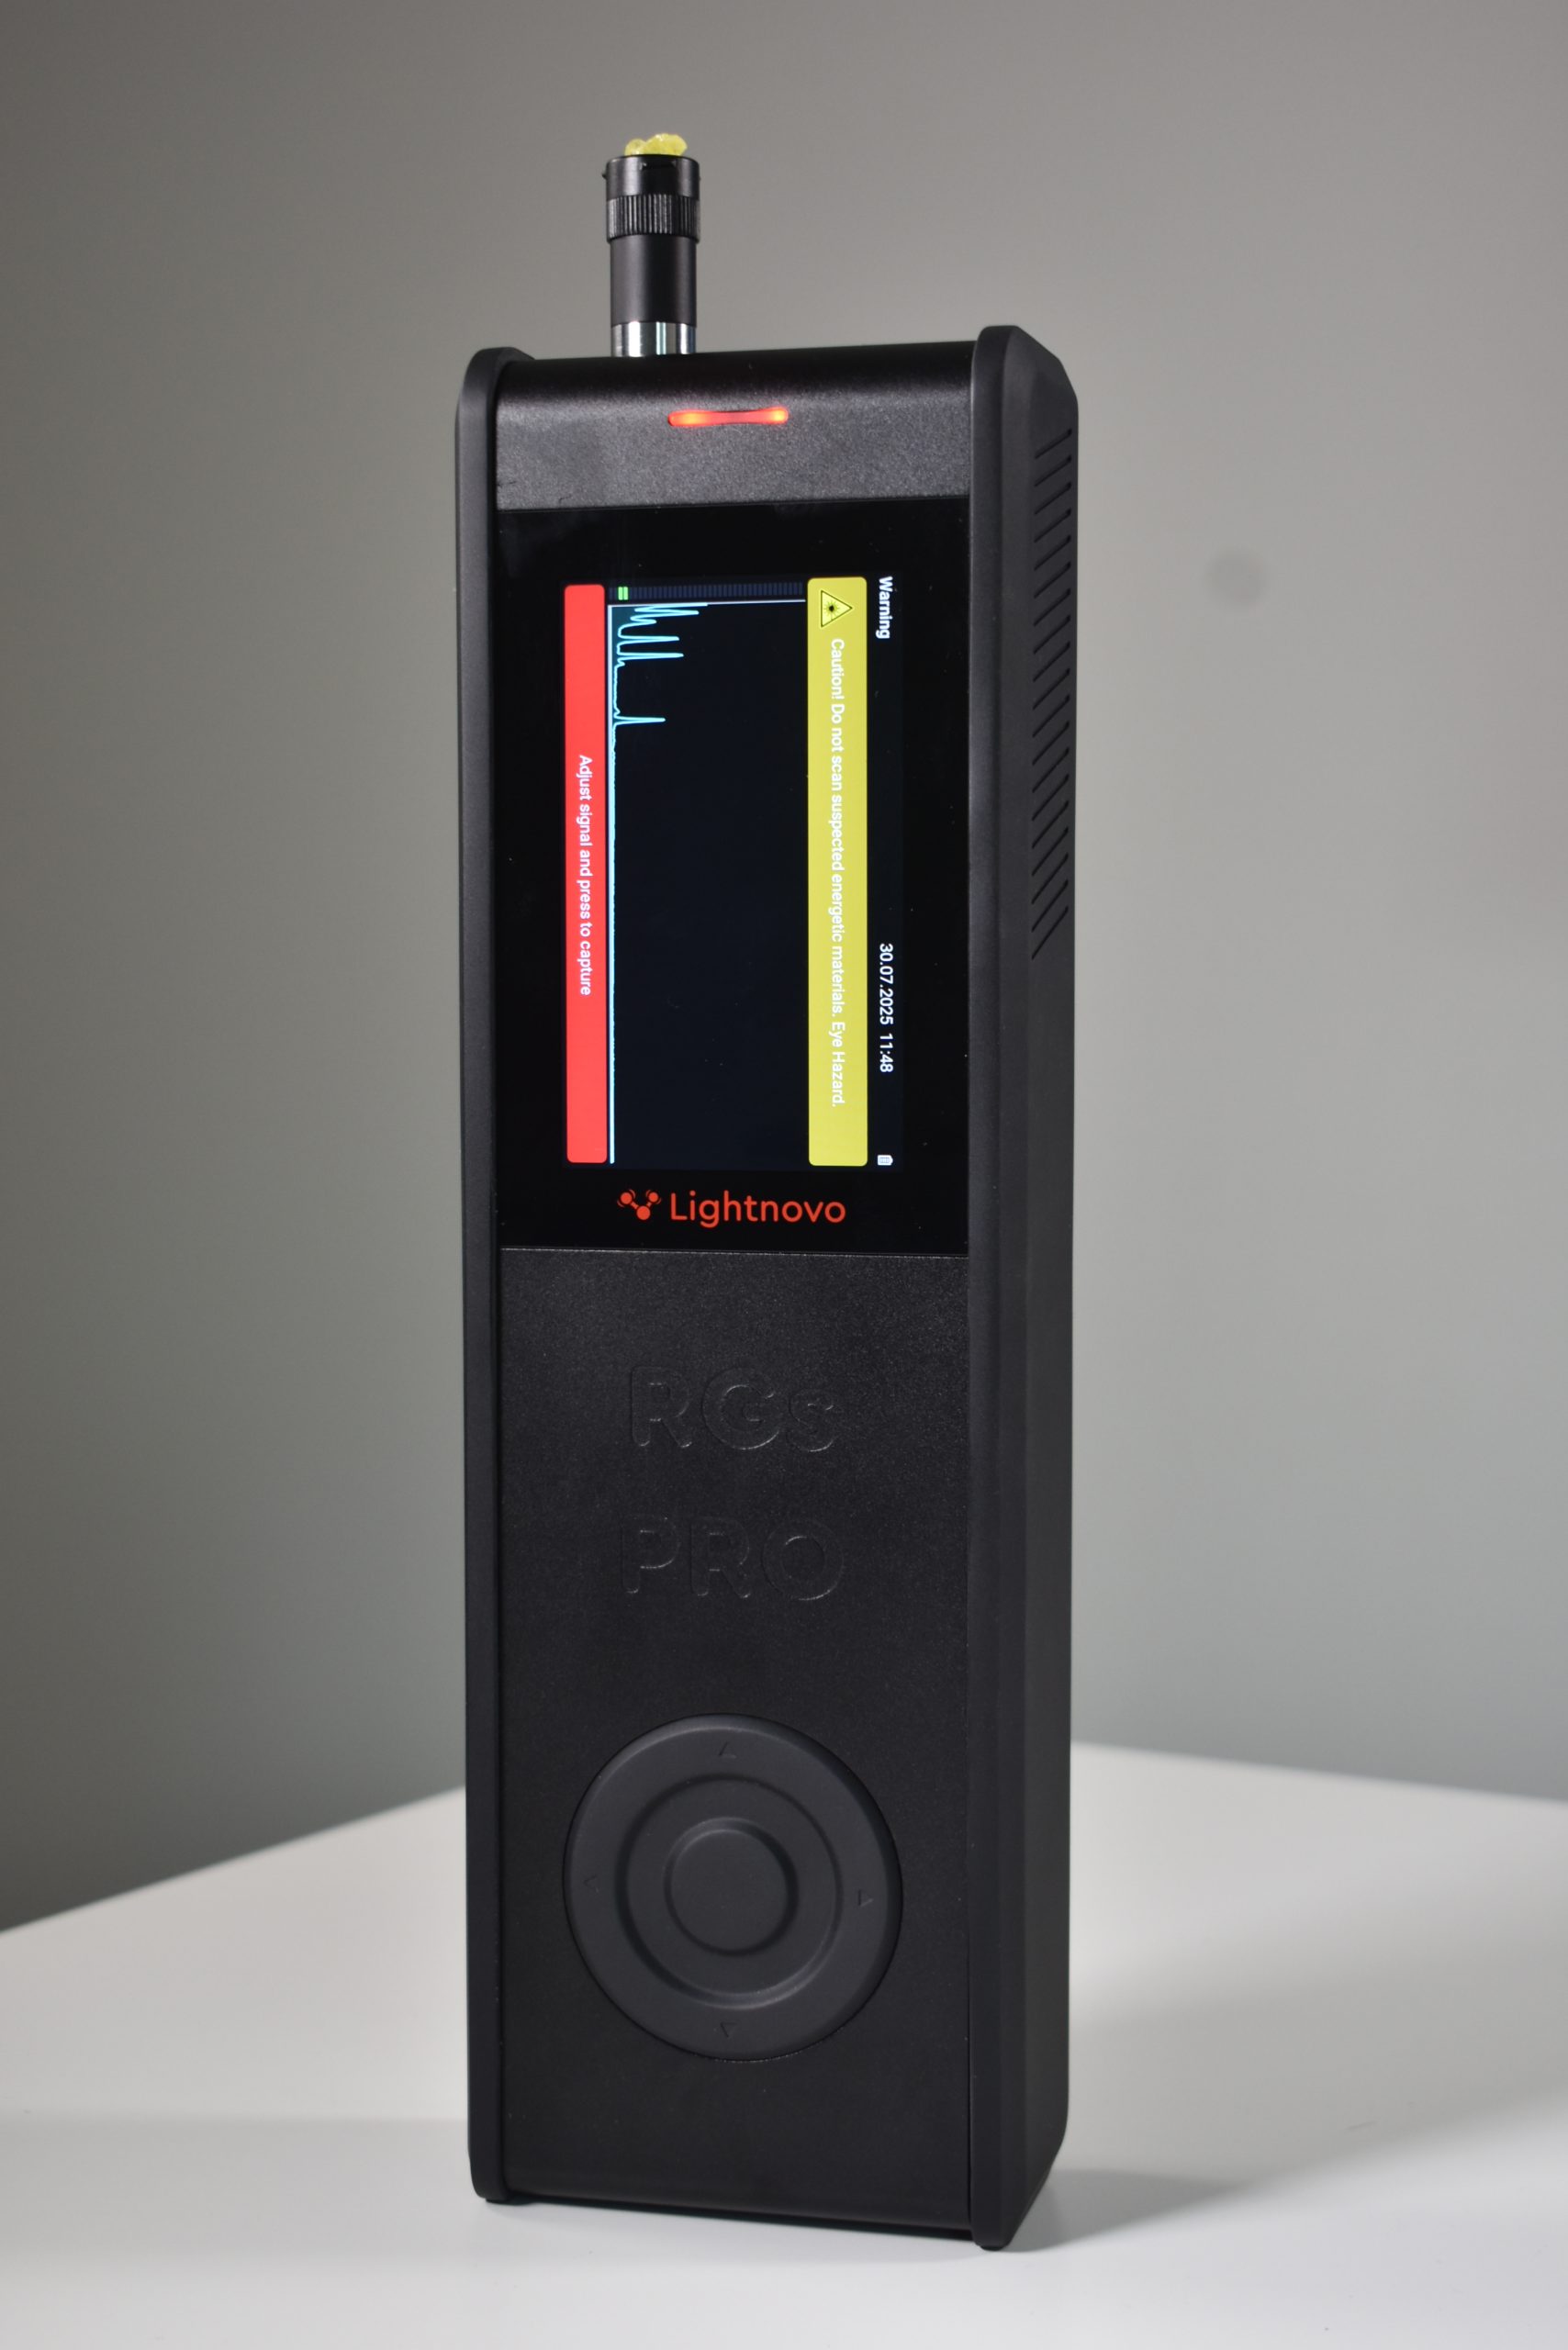
RG Pro Spectrometer
Unlock the Low-Frequency Raman and explore what standard Raman spectrometers cannot see
Unique Selling Points
RG Pro Spectometer Key Features RG Pro Spectometer Key Features RG Pro Spectometer Key Features

Ultra-low-frequency detection
(25 – 70 cm⁻¹)

Simultaneous access to low frequency (below 70 cm⁻¹) and fingerprint regions

High Spectral Resolution
and excellent signal-to-noise ratio

Multiple laser options
532 / 785 / 830 nm

Compact and portable

Compatible with microscopes
Technology Technology Technology
The RG PRO extends Lightnovo’s Raman range below 70 cm⁻¹ — reaching the low frequency ( THz -terahertz)) range that reveals intermolecular and lattice vibrations.
This means direct insight into crystal structure, phase transitions, and polymorphism — all within one compact, high-performance instrument.
Why Low-Frequency Raman Matters
Below 200 cm⁻¹ lies the structural fingerprint of materials —
lattice vibrations, phonon modes, and weak intermolecular forces that determine stability, crystallinity, and phase behavior.
The RG PRO opens this region, delivering a complete vibrational picture from 25 to 4000 cm⁻¹ in one scan.


Technical Specifications Technical Specifications Technical Specifications
| Feature versus model | PRO RG spectrometer 532 | PRO RG spectrometer 785 | PRO RG spectrometer 830 |
|---|---|---|---|
| Laser wavelength | 532nm | 785 nm | 830 nm |
| Power on sample | 10-100 mW 0.01-90 mW (LPR) |
10-95 mW 0.01-80 mW (LPR) 5->500 mW (Power) 0.01->500 mW (Power LPR) |
5-70 mW 0.01-65 mW(LPR) 10->500 mW (Power) 0.1-400 mW (Power LPR) |
| Spectral Range | 38-3700 cm⁻¹ 38-2040 cm⁻¹ (HR) |
25 - 2500 cm⁻¹ | 40 - 2400 cm⁻¹ |
| Spectral Resolution | 4 / 5 / 6 cm⁻¹ 2.3 / 3 / 3.7 cm⁻¹ (HR) |
3 / 4 / 5 cm⁻¹ | 3 / 4 / 5 cm⁻¹ |
| Signal-to-noise ratio | 1200:1 1000:1 (LPR) 800:1 (HR) 600:1 (HR LPR) |
1000:1 800:1 (LPR) 3000:1 (Power) 2500:1 (Power LPR) |
900:1 800:1 2500:1 (Power) 2000:1 (Power LPR) |
Specifications
*Actual laser power range can differ ± 2 % per device. Please contact us if you need specific laser power range values.
** Slit size dependent; slit size can be customized (20,35,50 um slits)
*** Determined as peak signal-to-noise ratio of polystyrene spectrum at maximal laser power,
integration time 0.3s, number of repetitions 10.
RG PRO vs RG Spectrometer RG PRO vs RG Spectrometer RG PRO vs RG Spectrometer
| Feature | RG Spectrometer | RG PRO Spectrometer |
|---|---|---|
| Spectral range | 70 – 4000 cm⁻¹ | 25 – 4000 cm⁻¹* |
| Low-frequency capability | Limited | THz-optimized filters |
| Information | Molecular fingerprint | Fingerprint + intermolecular / lattice modes |
| Applications | Standard Raman analysis | Advanced R&D: polymorphs, 2D materials, phonons |
| Form factor | Handheld/Portable / OEM integration | Handheld/Portable / OEM integration |
| Size and Weight | 257 x 110 x 61 mm; 1,5 Kg | 350mm, 110mm, 61mm; 1,650 kg |
| Laser wavelenght | 532 / 638 / 785 / 830 | 532 / 785 / 830 |
*The exact range depends on excitation wavelength, please check datasheets
Extra Benefits Extra Benefits Extra Benefits
Reveal intermolecular dynamics invisible to standard Raman
Distinguish polymorphic and crystalline phases
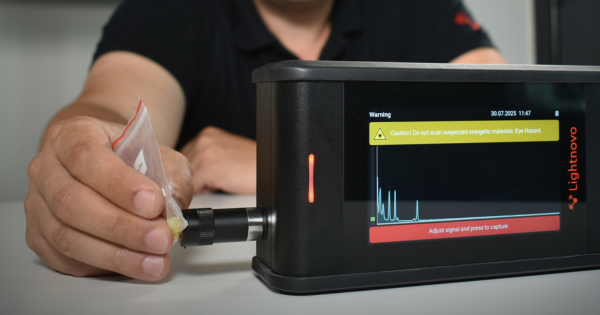
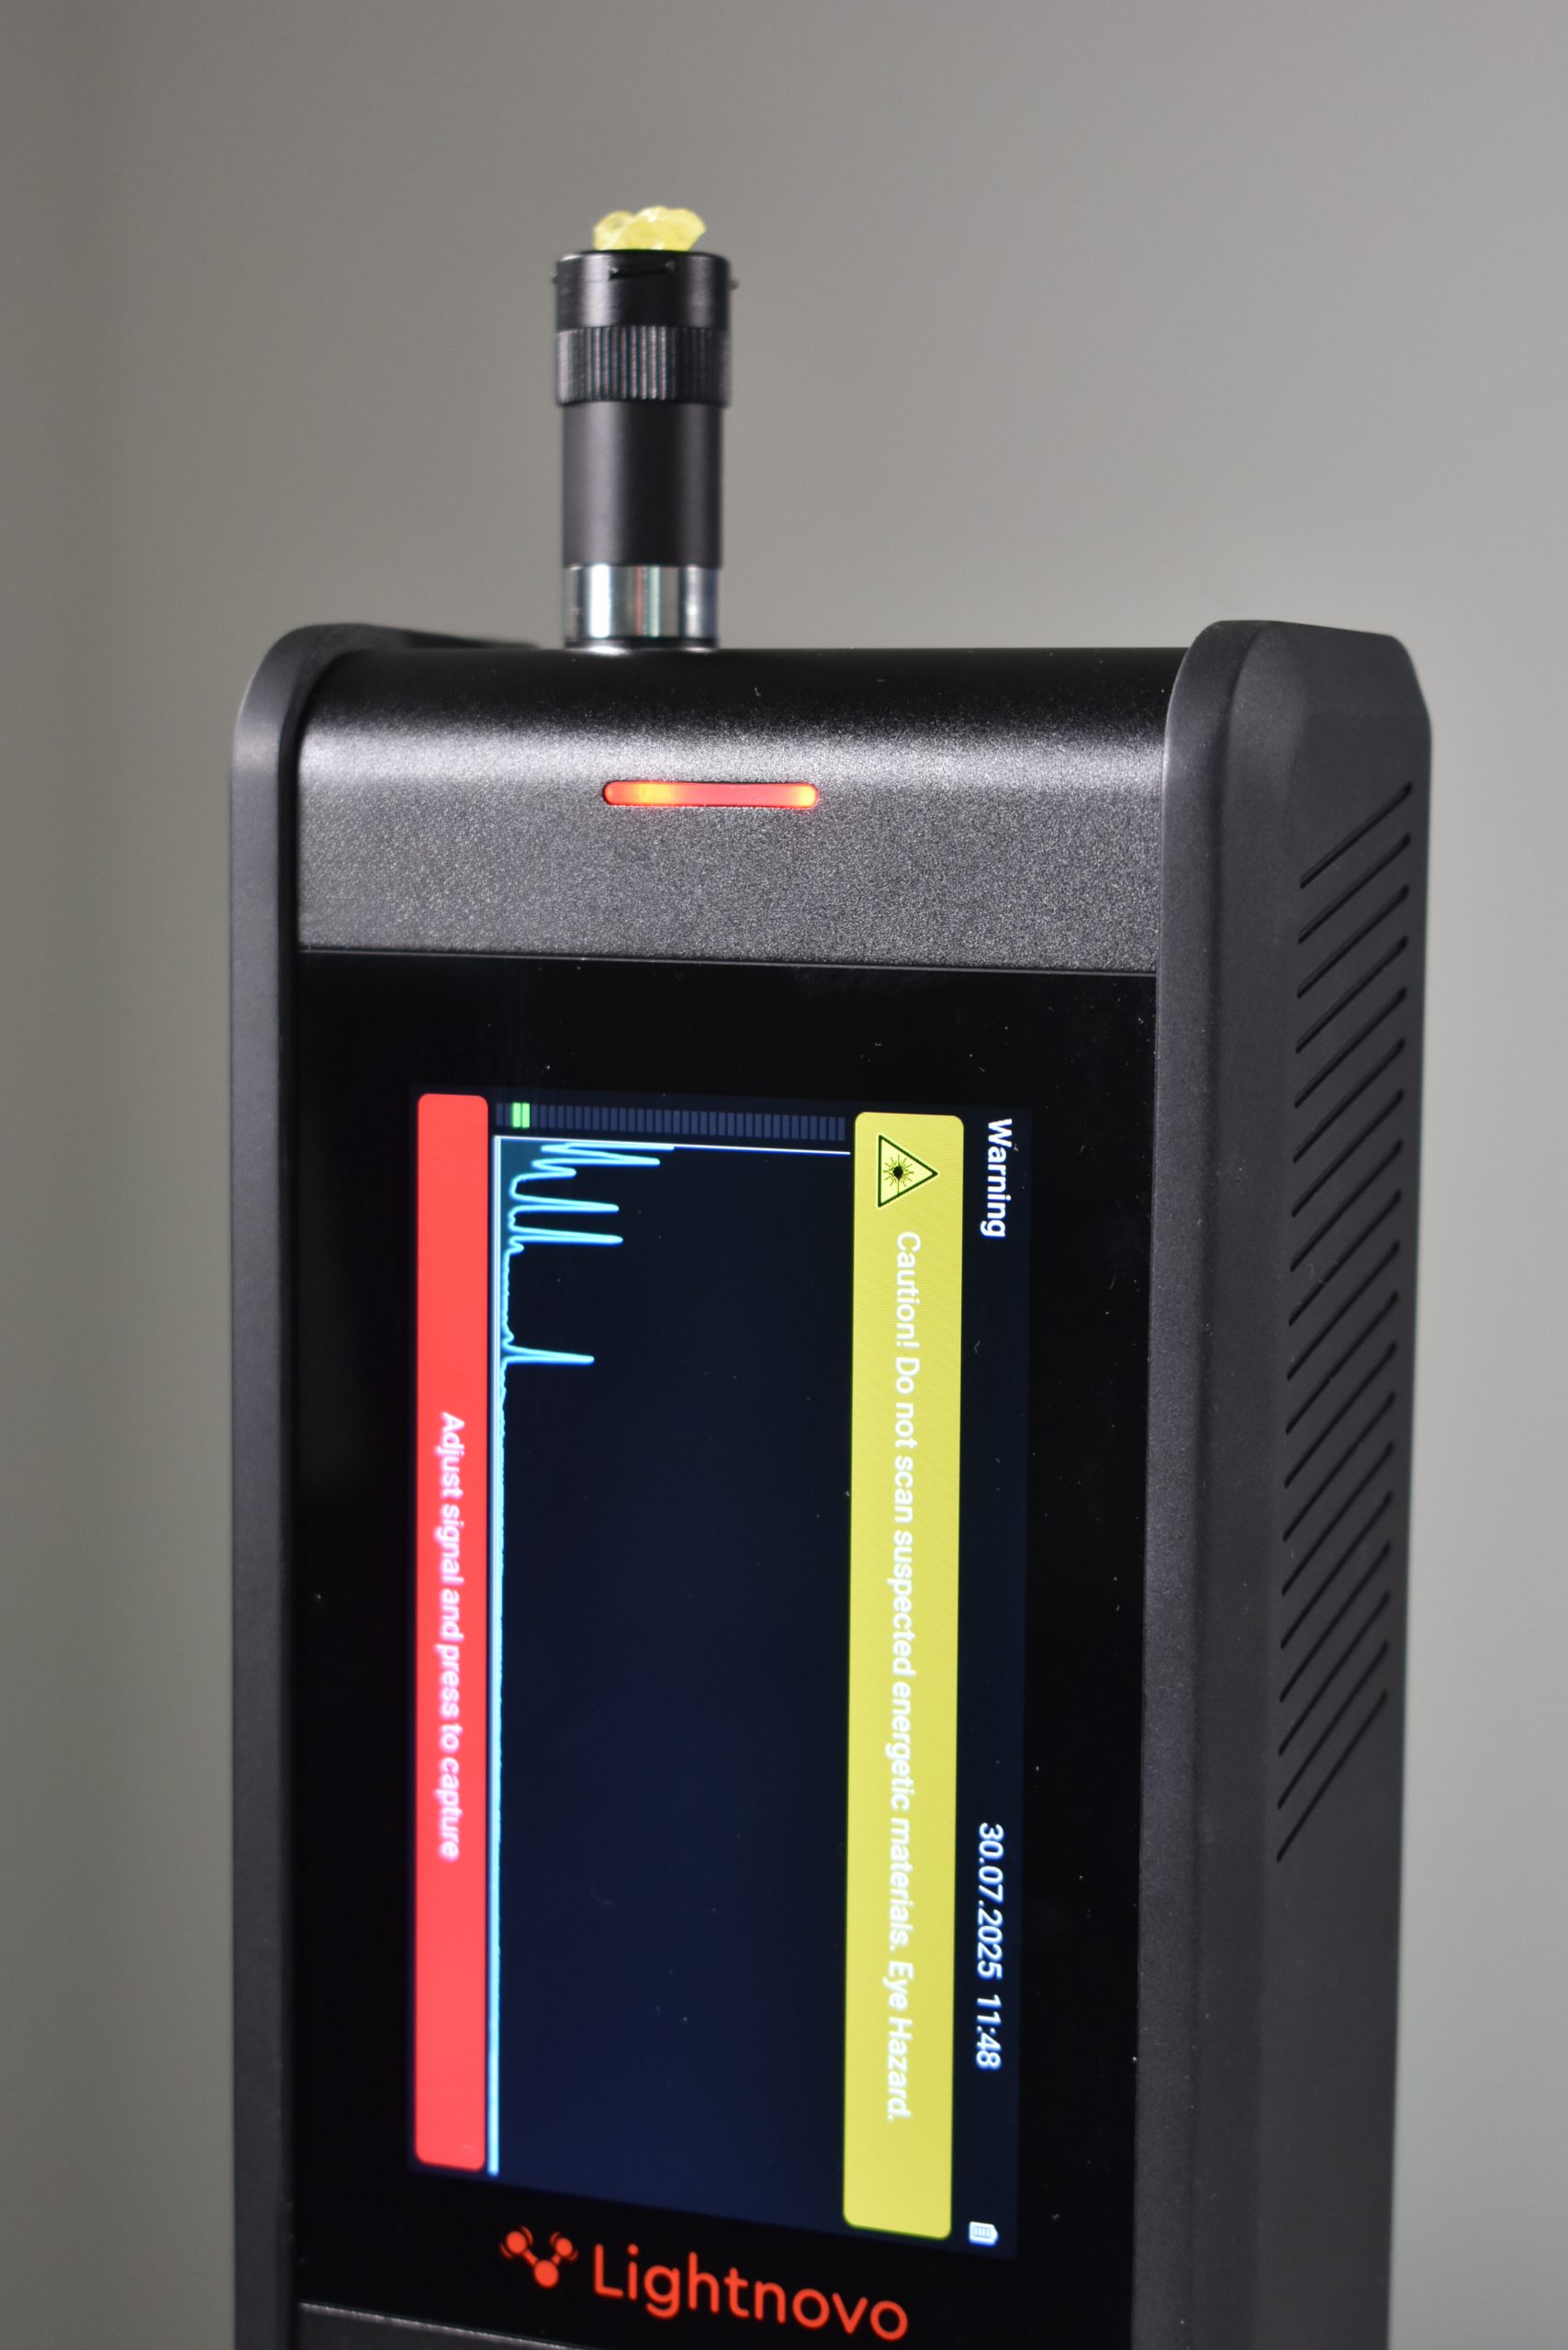
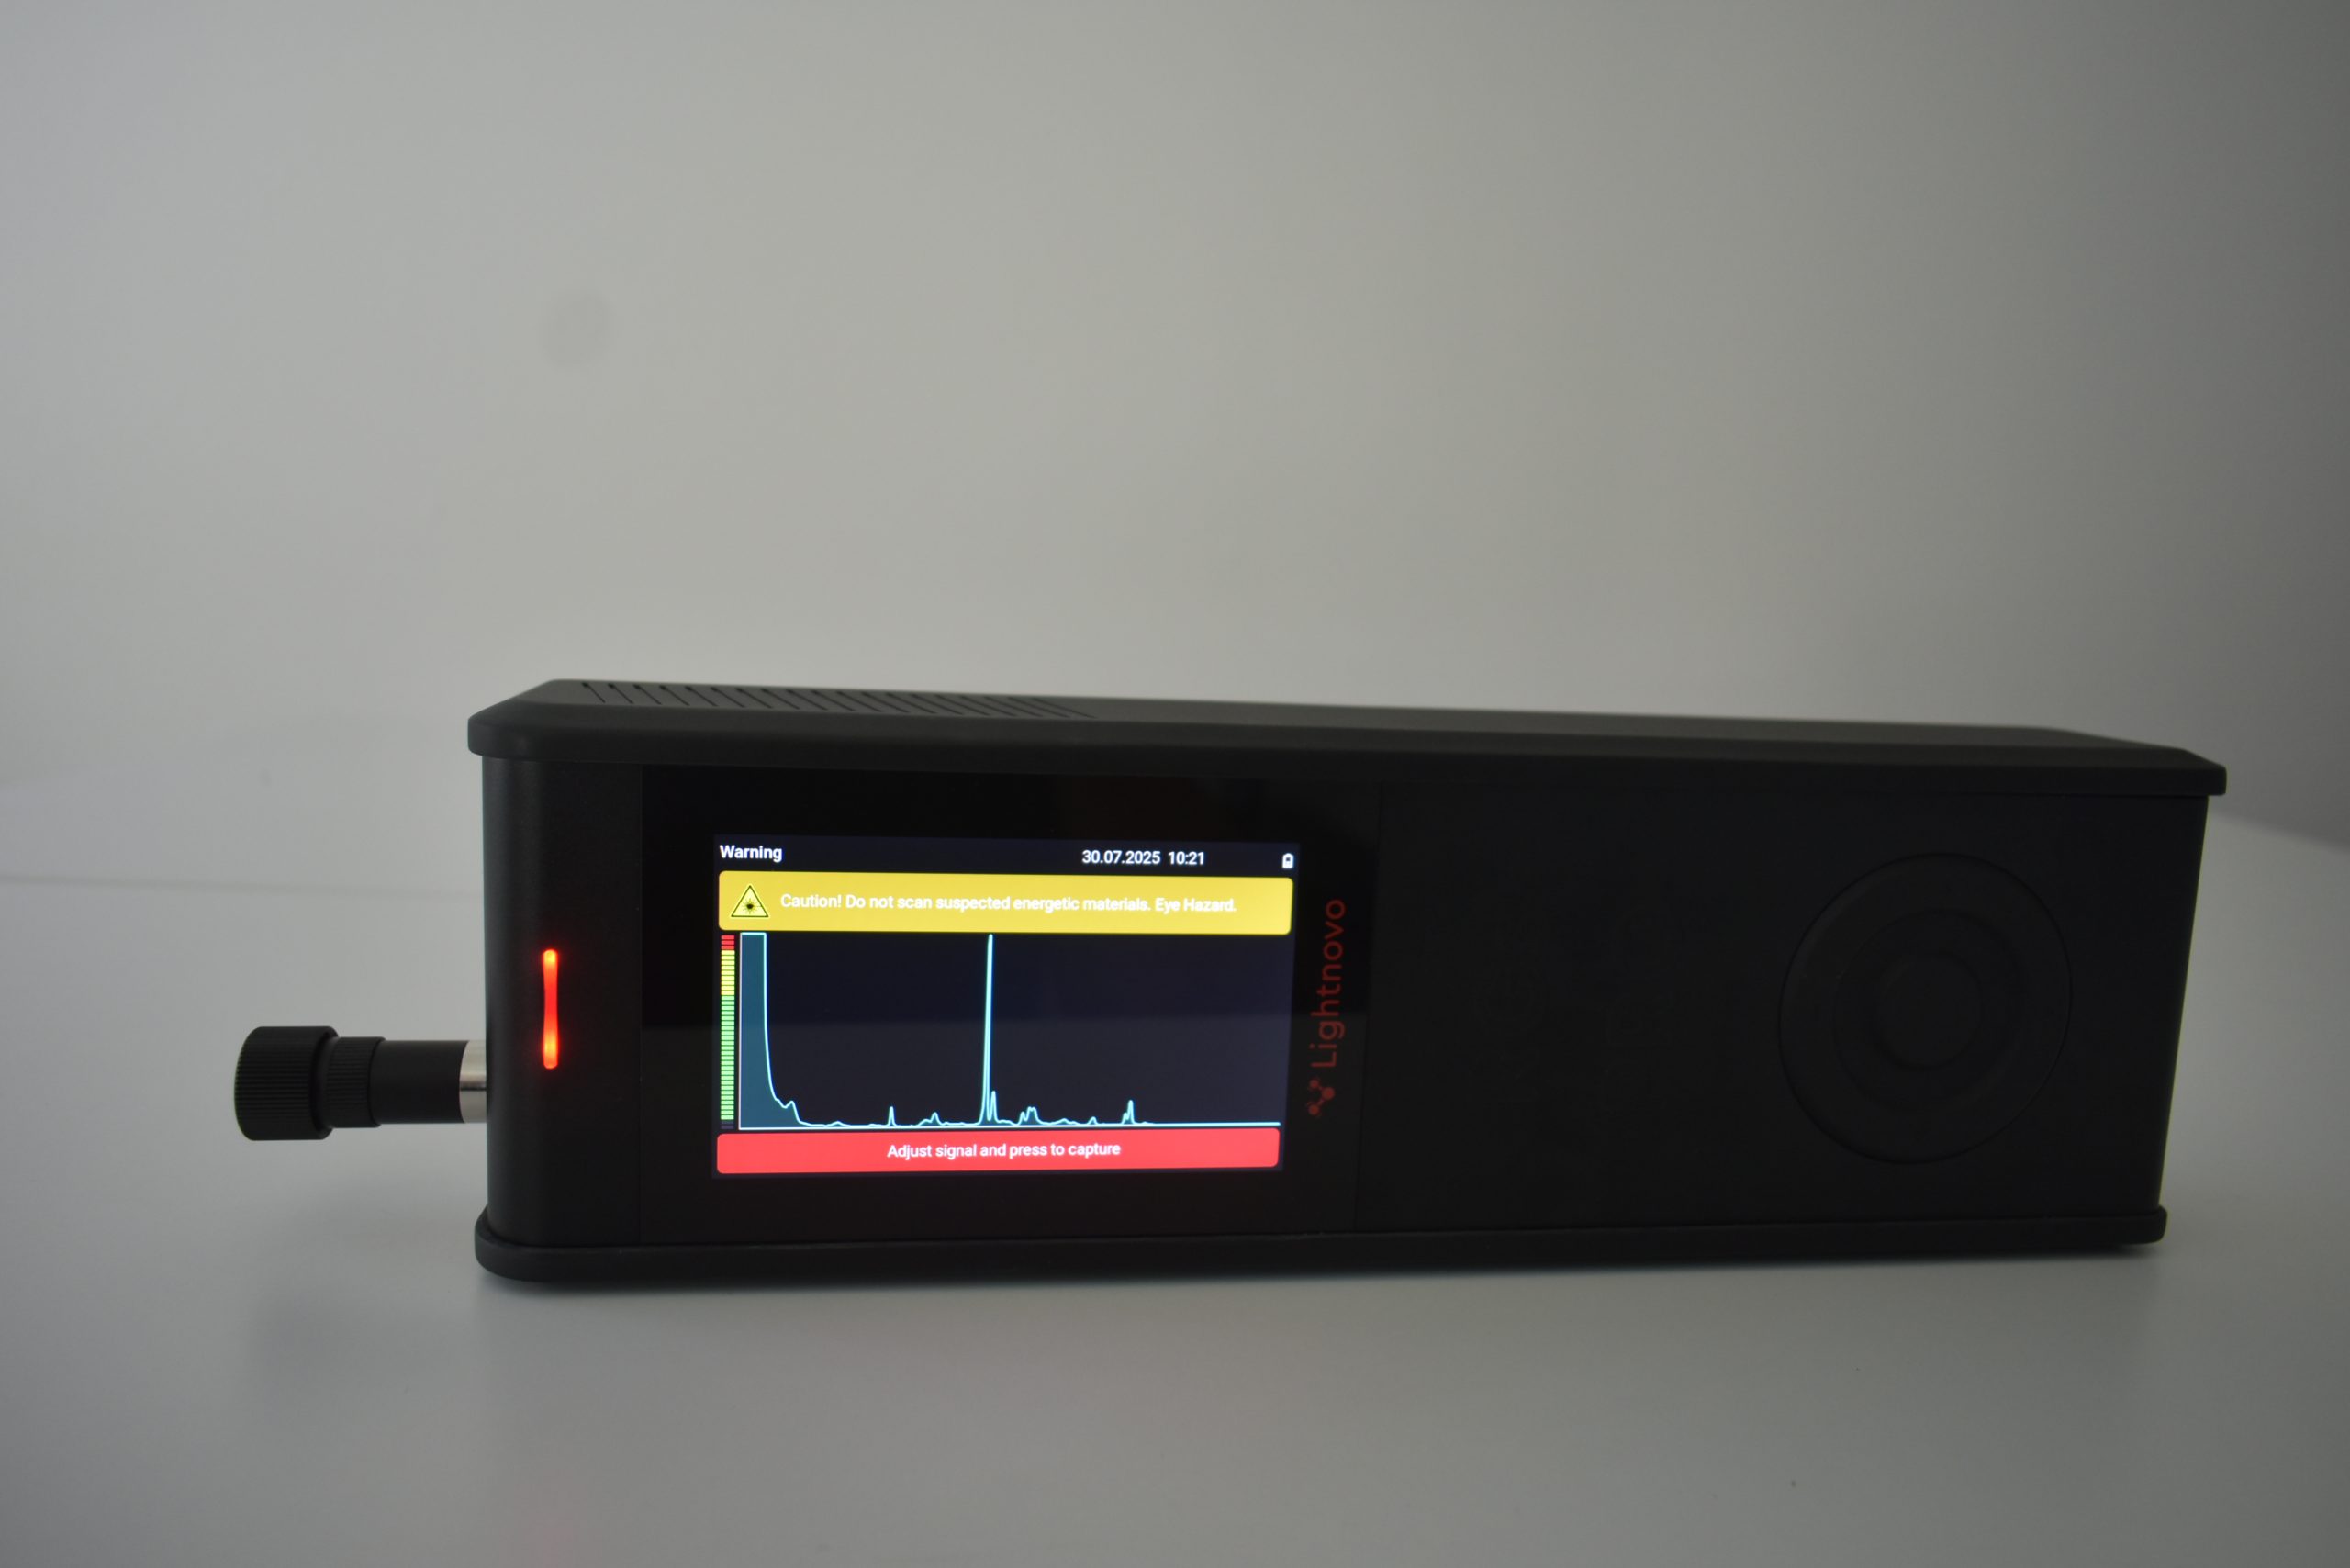
Perform non-destructive, fast measurements
Compact and reliable for both laboratory and OEM integration
Miraspec Miraspec Miraspec
Spectrometer system controlled by smartphone orPC via Bluetooth or USB-C cable.
| Data acquisition |
Laser power control
Exposure time control
Sensor gain control
Number of repetitions control
Spectral range control
|
|---|---|
| Data format |
Export data in the following formats: tsv, txt and jdx
|
Data preprocessing options |
Spike correction
(Whittaker-Hayes, moving window) Spectral smoothing (Whittaker, asymmetric least squares, Savitzky-Golay) Baseline correction (rolling circle, rubberband, least squares, asymmetrically reweighted penalized) Spectrum normalization (Z-score, mean, Mean centre, MinMax, Unit Norm L1, Unit Norm L2) |
| Data Exploration |
Principal component analysis Non-negative matrix factorization (SIMPLISMA-NNLS, MCR-ALS) |
| Qualitative analysis |
Material identification (Pearson correlation, square Euclidean cosine, square first difference Euclidean cosine) Creation of spectral libraries |
| Quantitative analysis |
Principal component regression
Raman peak height/peak area calibration Partial Least Squares (PLS) calibration |
| Classification | Random Forest, Linear SVM, AdaBoost, Decision Tree, Hoefding Tree, Naïve Bayes, Perceptron, Softmax Regression |
Applications Applications Applications
For researchers, industries, universities and general consumers.

Pharmaceuticals
crystallinity & polymorphism of APIs and excipients

Biomedical diagnostics
biomolecular interactions and tissue organization
Semiconductors and Nanomaterials
organic & 2D materials, quantum-dot phonon analysis

Industrial and Petrochemical
structural properties of the products

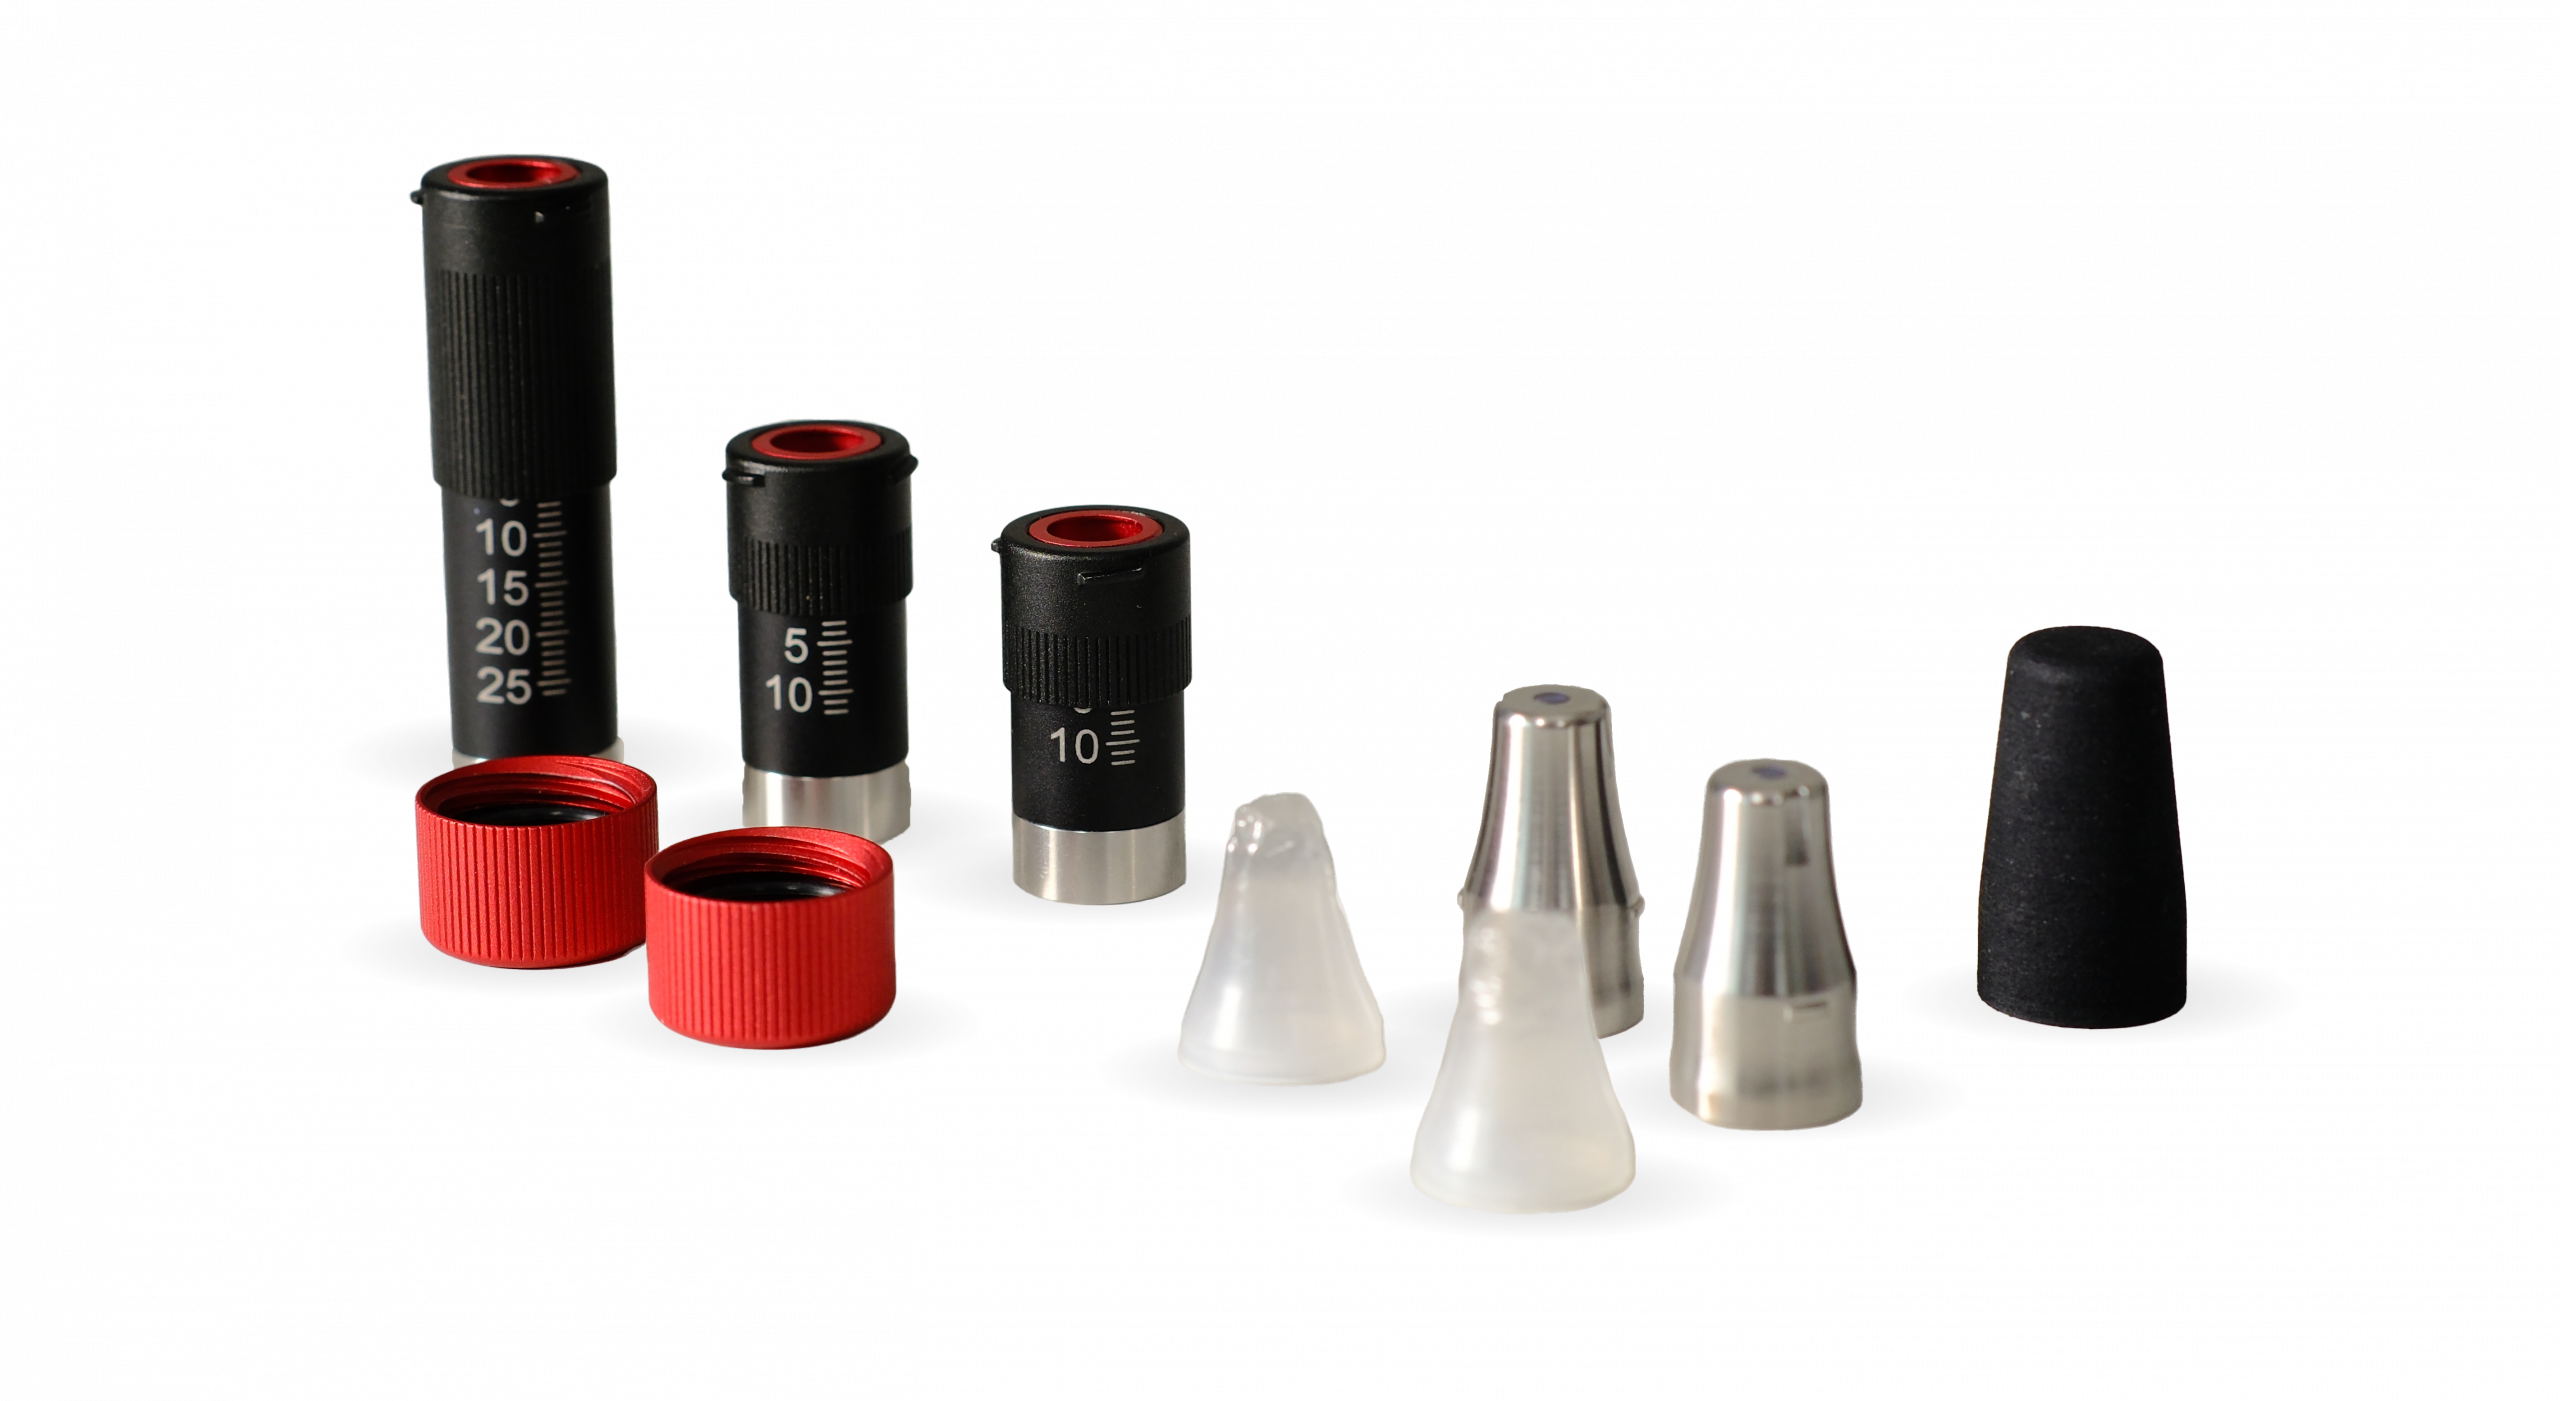
Accesories Accesories Accesories
- Short distance probe variable (with tool), NA=0.64, WD=0-2500um
- Middle distance probe (NA = 0.2, WD = 10 mm) for LN Spectrometers
- Long distance probe (NA = 0.1, WD = 25 mm) for LN Spectrometers
- Universal probe (NA=0.2, WD = 10mm) for LN Spectrometers
- Contact probe variable (NA = 0.6, WD = 0-300 um) for LN Spectrometers
- Contact probe fixed (NA = 0.6, WD = 10 um, PSF = 10 μm) for LN Spectrometers
- Contact probe fixed (NA = 0.6, WD = 50 μm, PSF = 15 μm) for LN Spectrometers
- Contact probe fixed (NA = 0.6, WD = 100 μm, PSF = 20 μm) for LN Spectrometers
- Contact probe adjustable (NA = 0.6, WD = 0-2500 um) for LN Spectrometers
View all
- Probe extender (80 mm) for LN Spectrometers
- Probe extender (160 mm) for LN Spectrometers
- Vial adaptor - side measurment for LN Spectrometers
- Vial adaptor - bottom measurment for LN Spectrometers
- Calibration tool for LN spectrometers with polystyrene
- Calibration tool for LN spectrometers with calcite
- Pill maker for LN Spectrometers
- Probe cover for LN Spectrometers
- Black out cover for Short/Middle & Long Distance probes.
- Disposible tips for LN Probes (Box of 30pcs)
- Disposible tips for LN Probes (20 boxes of 30pcs) (edited)
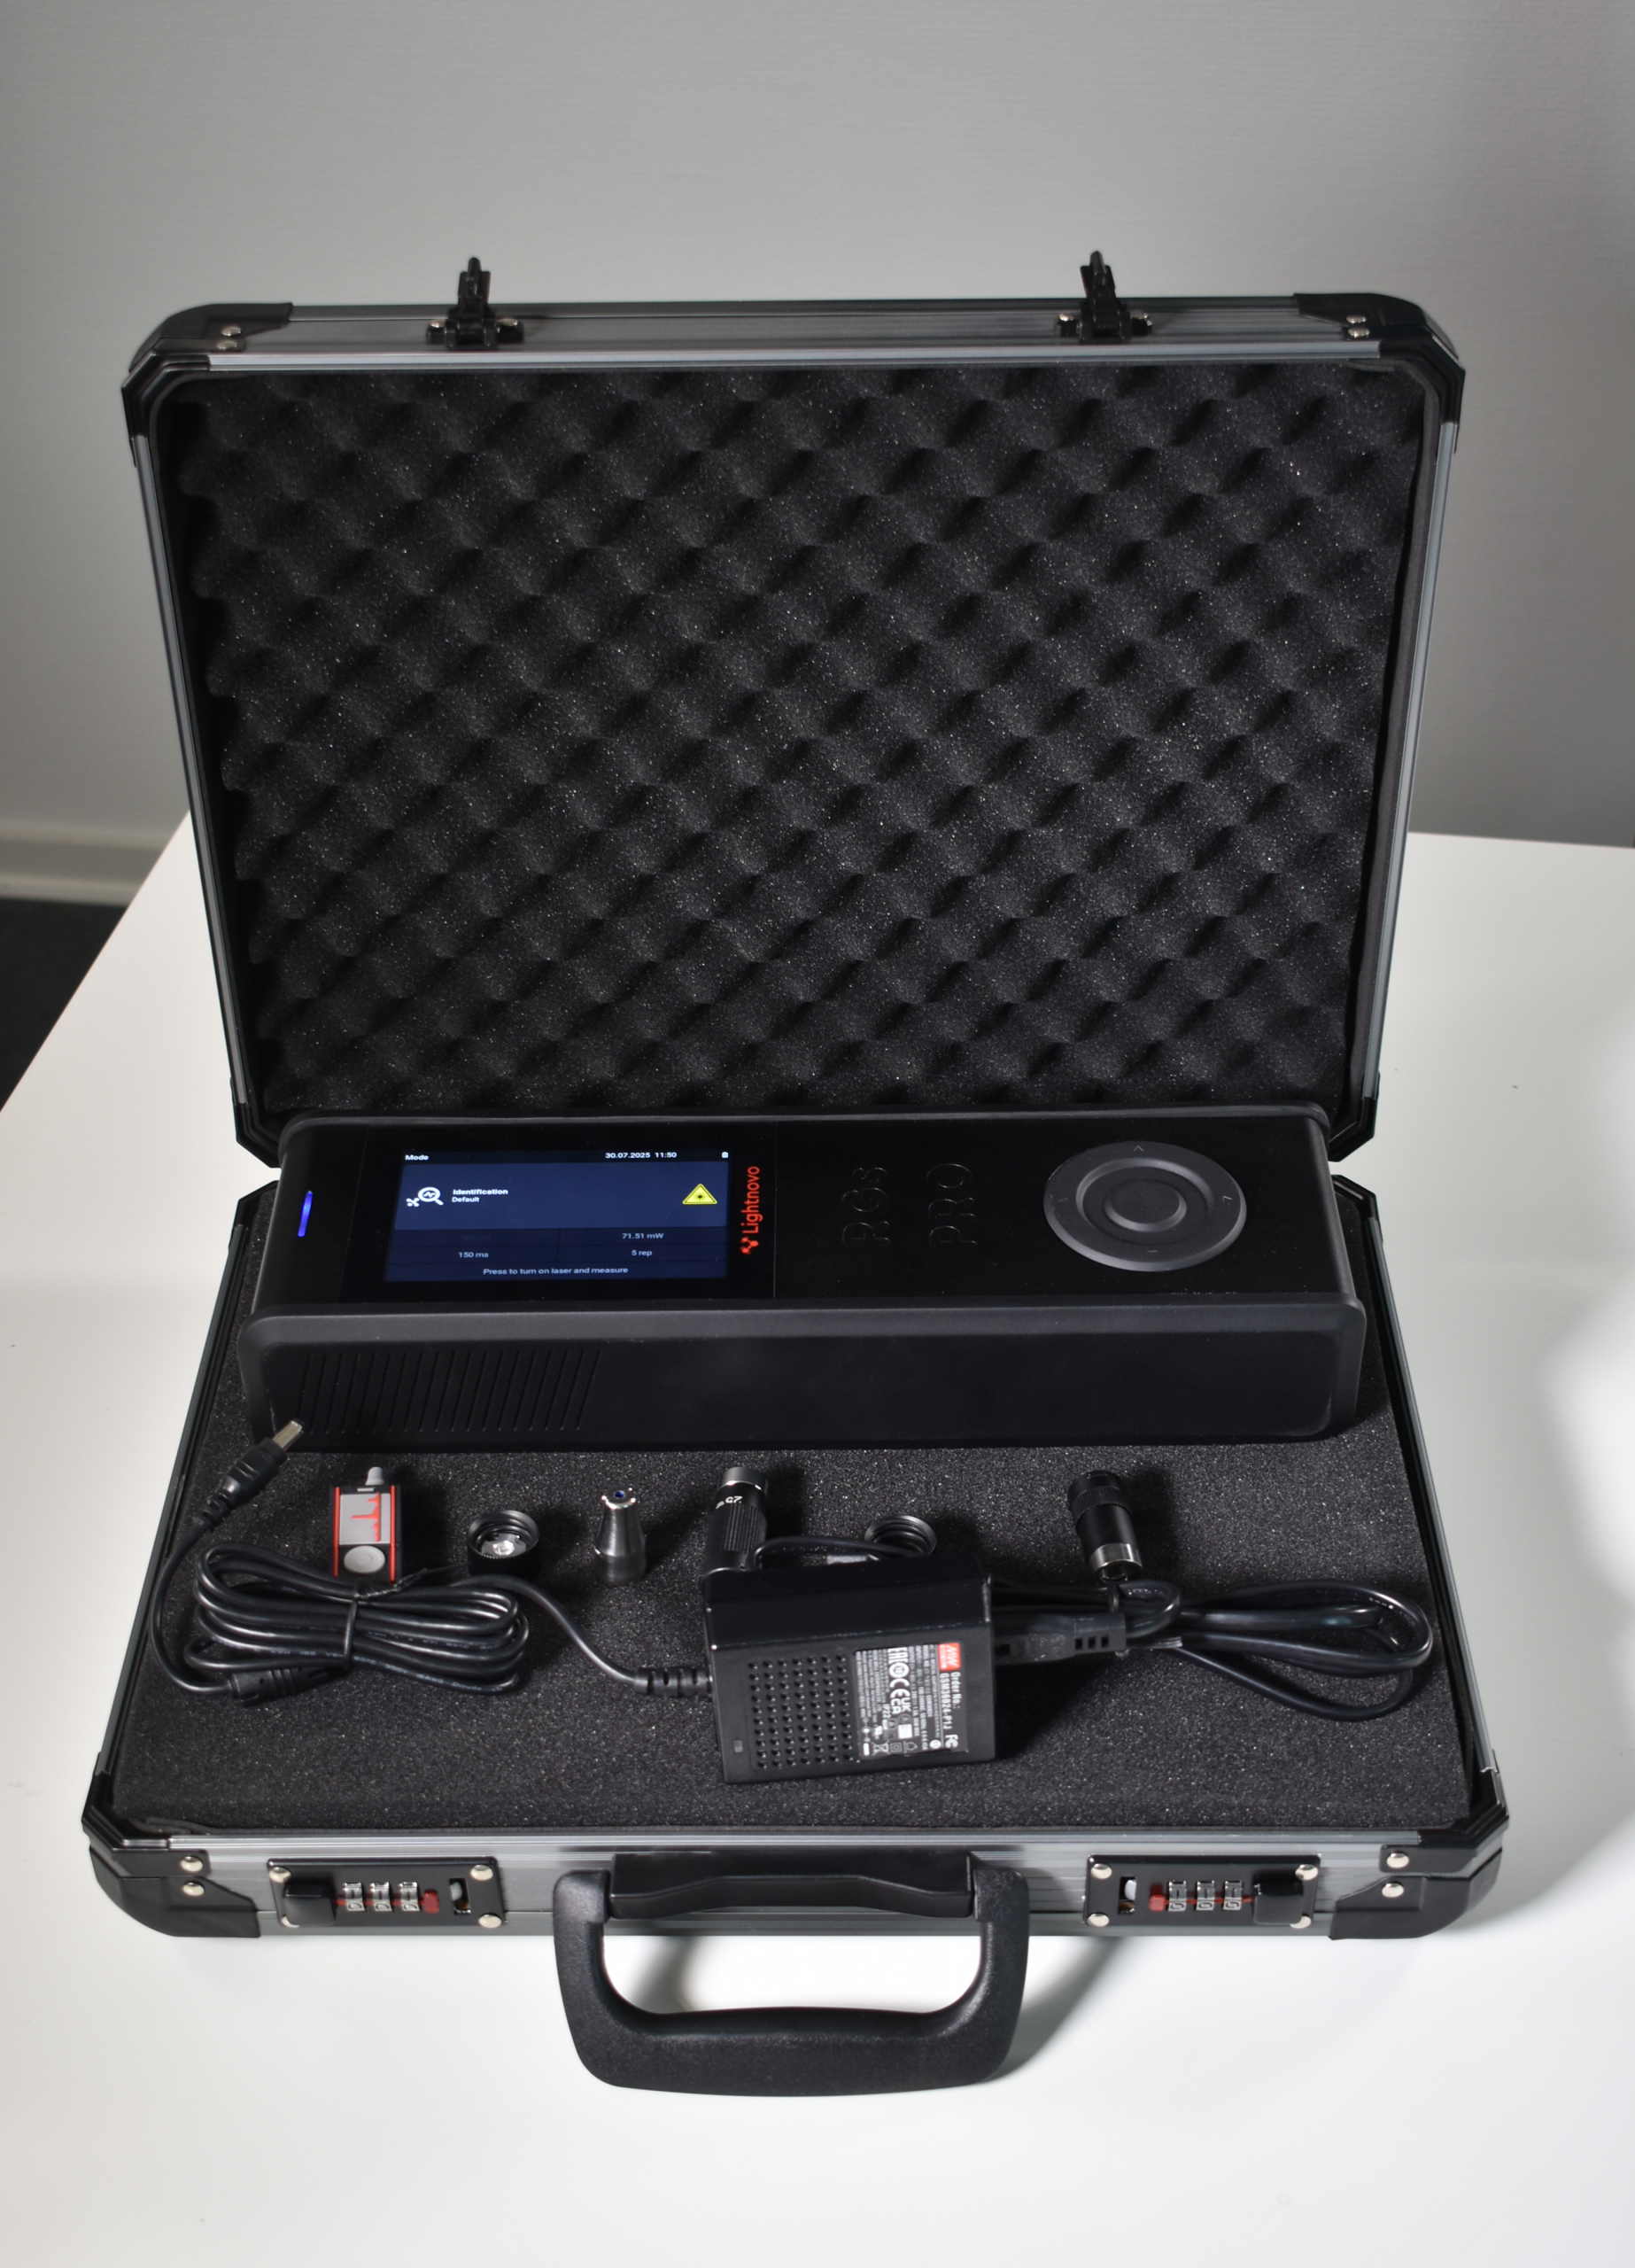
- Belt holster for miniRaman Spectrometer
- Charging Dock for miniRaman Spectrometer
- Carry case for miniRaman Spectrometer & miniRaman PRO spectrometer, standard