EduRaman Pro
Spectrometer
See the optics. Understand the principles. Explore spectroscopy.
What is EduRaman Pro? What is EduRaman Pro? What is EduRaman Pro?
EduRaman Pro transforms spectroscopy by “breaking the black box” into a hands-on learning experience. A modular educational platform combining Raman spectroscopy, microscopic imaging, absorption and fluorescence spectroscopy in one system. Its open optical path and modular design allow students to see the components, follow the optical path and understand how a spectrometer works while performing real experiments.
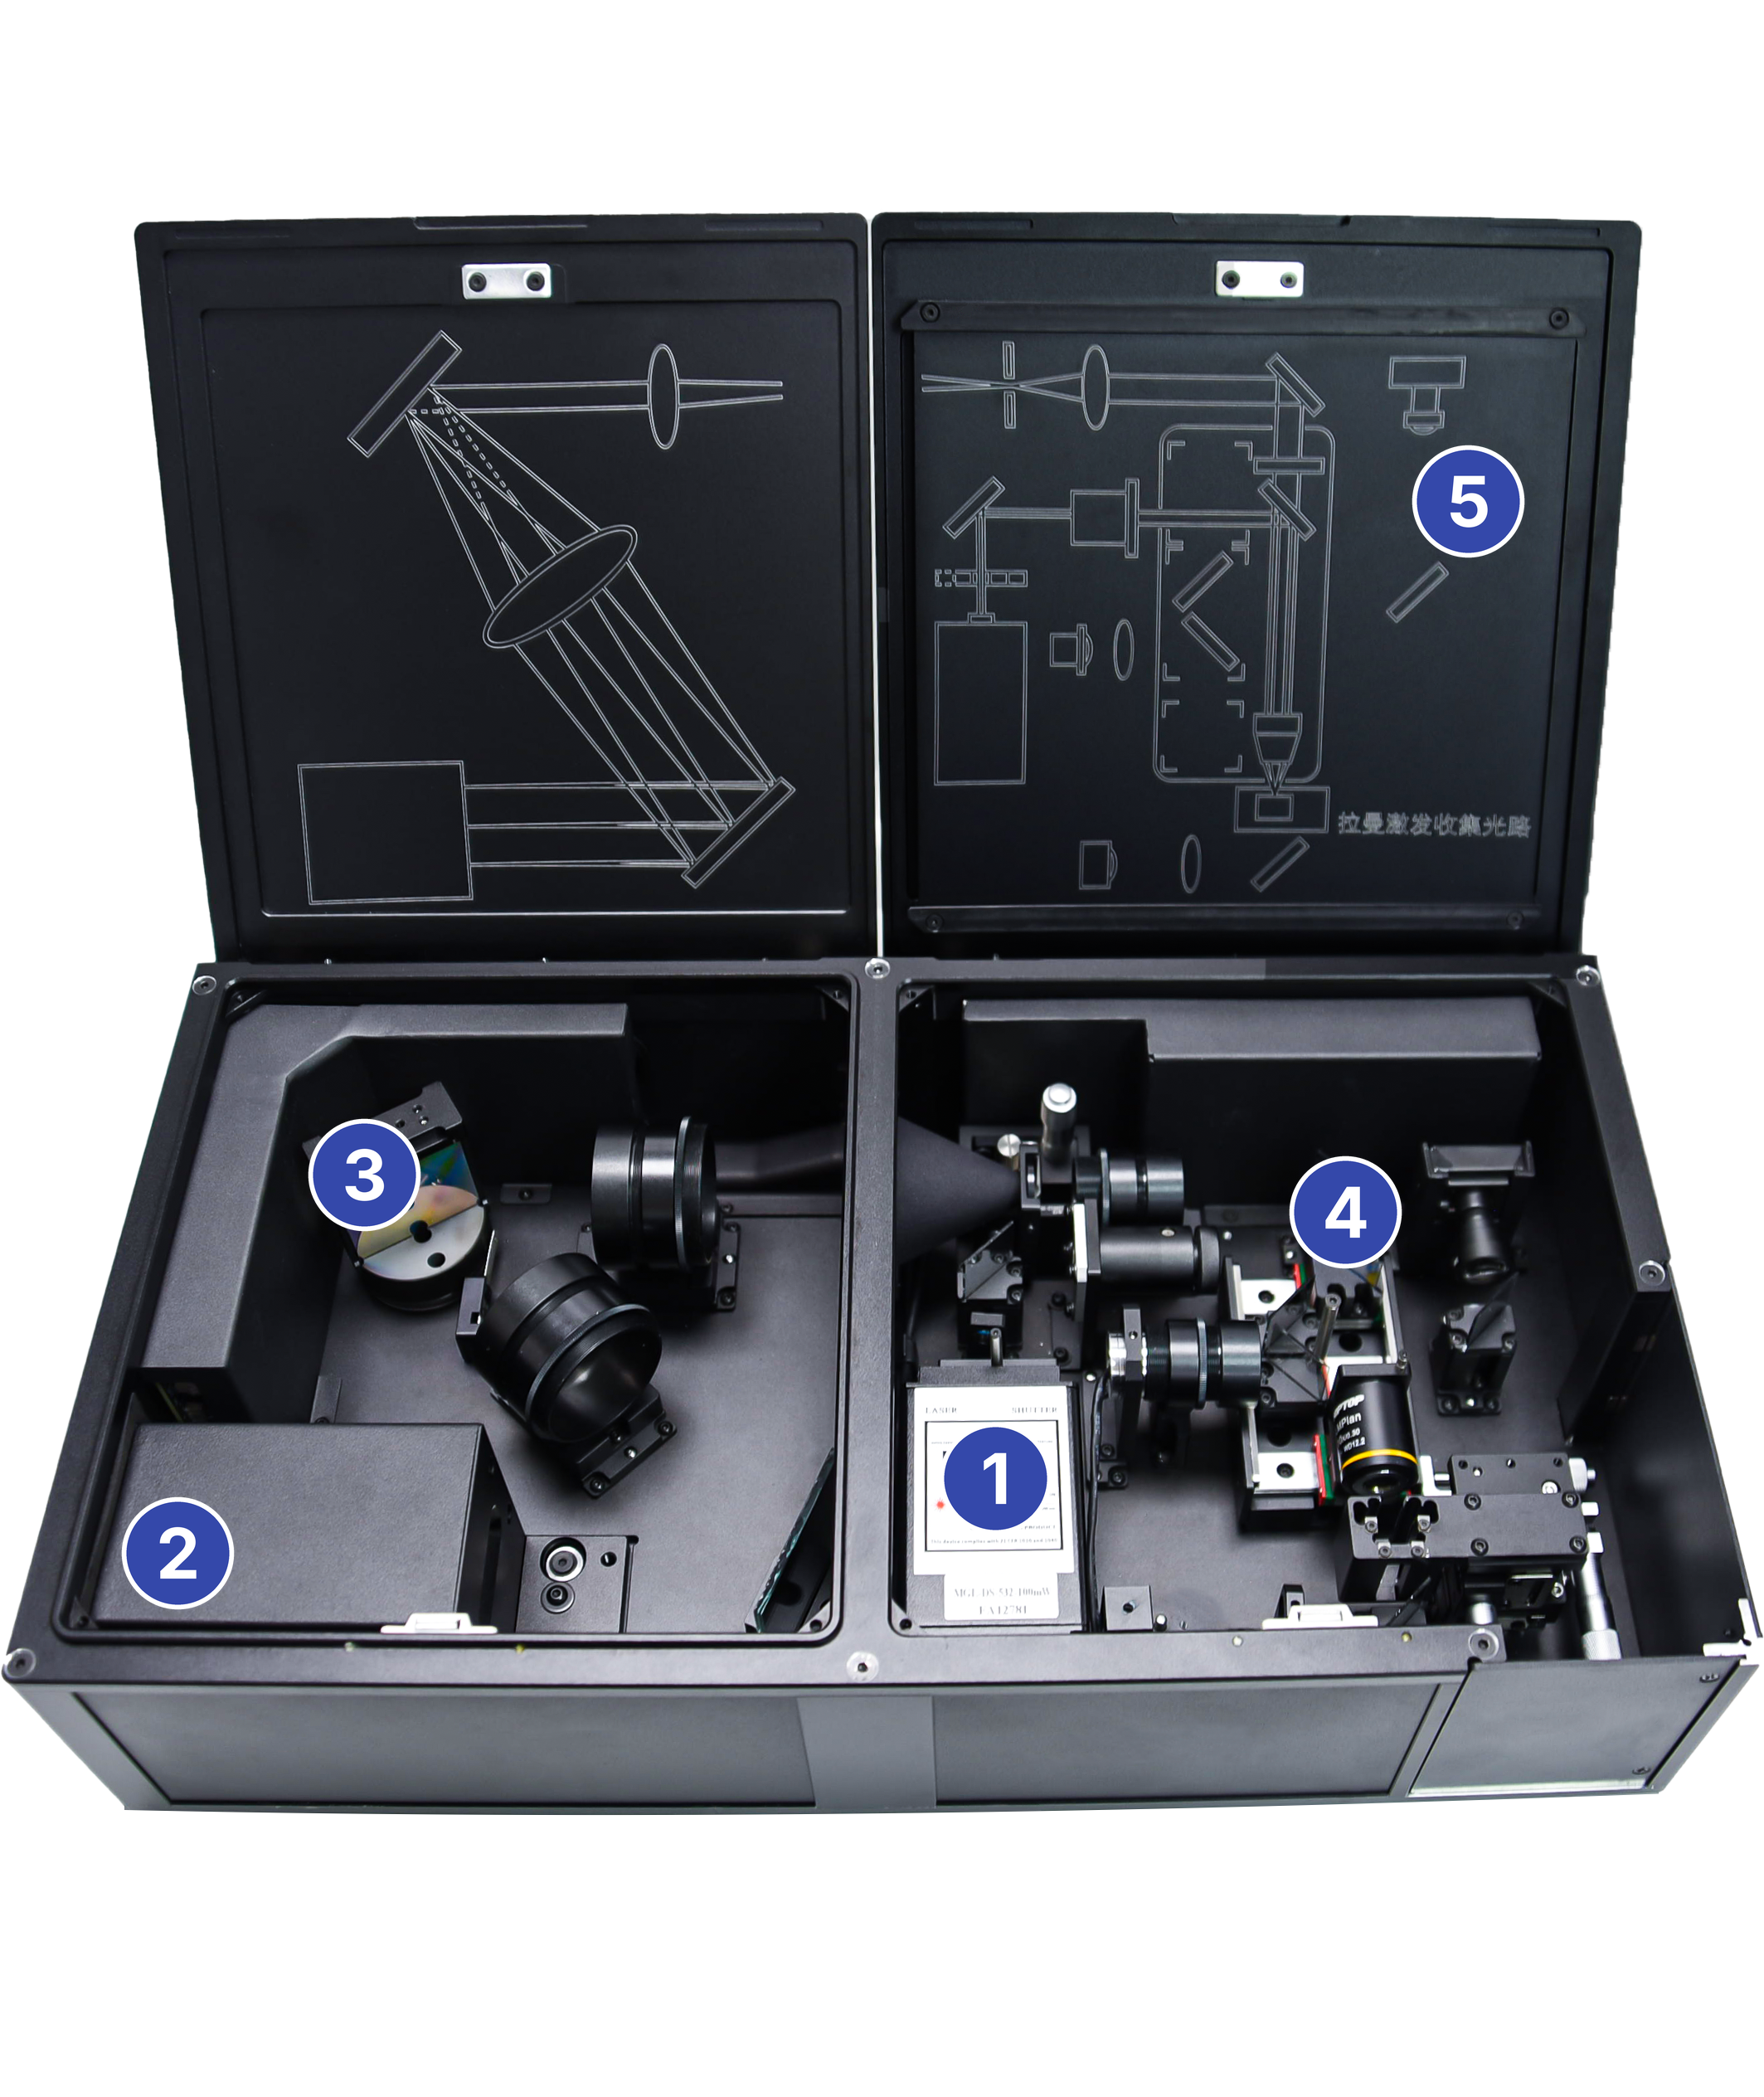
1. Laser
Supports multiple laser wavelengths, including 532 nm, 633 nm, and 785 nm.
2. CCD Detector
Equipped with a cooled CCD detector to effectively suppress thermal noise and significantly improve the signal-to-noise ratio.
3. Grating
High-density reflective grating with spectral resolution better than 6 cm⁻¹.
4. Sliding Switching Module
Enables free switching between bright-field imaging and multiple spectroscopic detection optical paths without recalibration.
5. Sliding Cover Plate
The optical path diagram on the cover plate clearly illustrates the working principle of the instrument.
Unique Selling Points
EduRaman Pro Key Features EduRaman Pro Key Features EduRaman Pro Key Features

Open Optical Path
See the laser, detector, grating and optical path directly.

Modular Architecture
Explore individual optical modules and complete instrument configurations.

More Than Raman
Combine Raman, microscopic imaging, absorption and fluorescence spectroscopy.

Multiple Excitation Wavelengths
Available with 532, 633 or 785 nm excitation.

Hands-on Learning
Connect spectroscopy theory directly with instrument operation and experiments.

From Fundamentals to Advanced Experiments
Move from Raman principles and material identification to quantitative analysis and reaction monitoring.
Key Benefits Key Benefits Key Benefits
01
Makes spectroscopy principles visible instead of hiding them inside the instrument.
02
Bridges theory and practice through hands-on optical and spectroscopy experiments.
03
One platform for multiple techniques, reducing the need for separate teaching instruments.
04
Supports different teaching levels, from introductory demonstrations to advanced laboratory experiments.
05
Encourages independent exploration by allowing students to understand components and configurations
06
Supports flexible curricula with teaching programmes ranging from approximately 6 to 18 hours.
Technical Specifications Technical Specifications Technical Specifications
| Feature versus model | EduRaman Pro 532 | EduRaman Pro 633 | EduRaman Pro 785 |
|---|---|---|---|
| Laser wavelength | 532 nm | 633 nm | 785 nm |
| Raman spectral range* | 150–2400 cm⁻¹ / 2400–4000 cm⁻¹ | 150–2200 cm⁻¹ / 2200–3900 cm⁻¹ | 150–2000 cm⁻¹ / 2000–3500 cm⁻¹ |
| Raman spectral resolution* | ≤ 6 cm⁻¹ | ≤ 6 cm⁻¹ | ≤ 6 cm⁻¹ |
| Spectral accuracy* | ≤ 3 cm⁻¹ | ≤ 3 cm⁻¹ | ≤ 3 cm⁻¹ |
| Spectral repeatability* | ≤ 1 cm⁻¹ | ≤ 1 cm⁻¹ | ≤ 1 cm⁻¹ |
| Absorption / fluorescence range | 450–950 nm | 450–950 nm | 450–950 nm |
| Detector | Front-illuminated FFT-CCD, 1024 × 60 pixels | Front-illuminated FFT-CCD, 1024 × 60 pixels | Front-illuminated FFT-CCD, 1024 × 60 pixels |
| Detector cooling | ≥ 15°C below ambient | ≥ 15°C below ambient | ≥ 15°C below ambient |
| Signal-to-noise ratio | ≥ 200:1** | ≥ 200:1** | ≥ 200:1** |
| Microscopic imaging | White LED illumination; simultaneous visualization of laser spot and bright-field image | Same | Same |
| Functions | Raman spectroscopy, microscopy, absorption & fluorescence spectroscopy | Same | Same |
| Calibration | Included | Included | Included |
| Dimensions | 52 × 28 × 13 cm | 52 × 28 × 13 cm | 52 × 28 × 13 cm |
| Weight | 15 kg | 15 kg | 15 kg |
| Interface | USB 2.0 | USB 2.0 | USB 2.0 |
| Operating system | Windows 10 or above | Windows 10 or above | Windows 10 or above |
| Software | EduRaman | EduRaman | EduRaman |
Specifications
* Raman specifications depend on the grating configuration: 1200 g/mm for 532 nm, 900 g/mm for 633 nm, and 600 g/mm for 785 nm. Absorption and fluorescence measurements use the 150 g/mm grating.
** Signal-to-noise ratio determined from the first-order silicon Raman peak.
Extra Features Extra Features Extra Features

Microscopic visualization
Simultaneously observe the sample, laser spot and bright-field image.

Flexible optical switching
Switch between imaging and different spectroscopy detection paths without recalibration.

Dual-grating configuration
Supports different spectroscopic measurement modes.

Built-in calibration
Designed to support practical instrument calibration as part of teaching.

Integrated knowledge resources
Software includes spectroscopy principles, terminology and supporting educational content.
Applications Applications Applications
For Universities and Educational purposes.

Raman Principle Verification

Material Identification

Quantitative Analysis

Concentration Measurements

Pigment Analysis

Reaction Kinetics & In-Situ Monitoring

Fluorescence Spectroscopy

Absorption Spectroscopy
Use Cases from the Teaching lab Use Cases from the Teaching lab Use Cases from the Teaching lab
QUALITATIVE ANALYSIS
Rapid Identification of Natural and Imitation Jadeite
Typical Raman peaks of jadeite appear at around 377, 700, and 1038 cm⁻¹.
Imitation materials may show no such peaks or display shifted peak positions.
Key Practice Points for Students:
- Identify the characteristic peaks of natural jadeite.
- Practice peak-position comparison using standard spectral libraries or literature data.
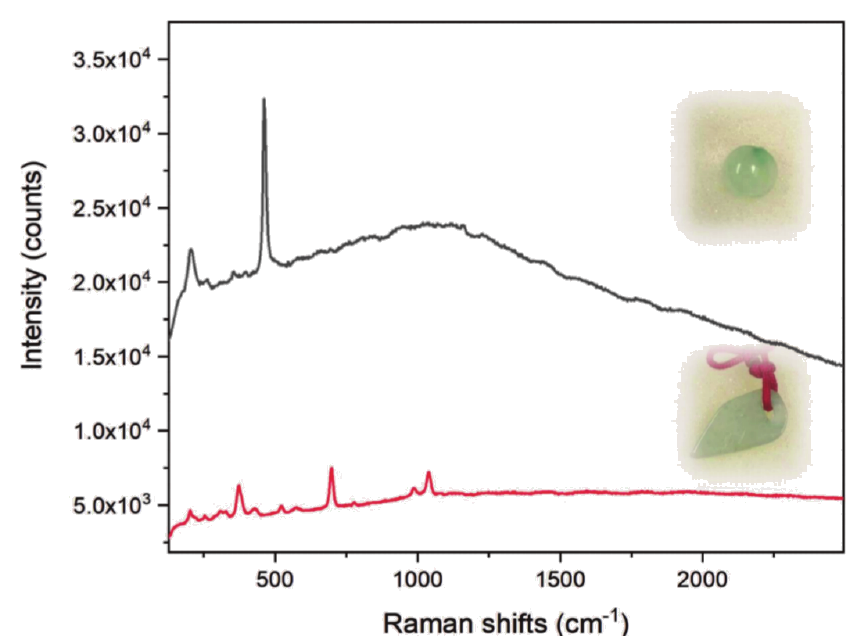
Figure: Raman spectra of natural and imitation jadeite
QUALITATIVE ANALYSIS
Detection of Pigments in Beverages
Conventional Raman spectroscopy often has difficulty detecting trace synthetic pigments. However, with surface-enhanced Raman spectroscopy (SERS), these pigments can be rapidly identified.
Key Practice Points for Students:
- Explore preliminary SERS-based detection methods.
- Understand how SERS helps overcome challenges in trace-level detection.
- Master characteristic peak comparison and spectral interpretation methods.
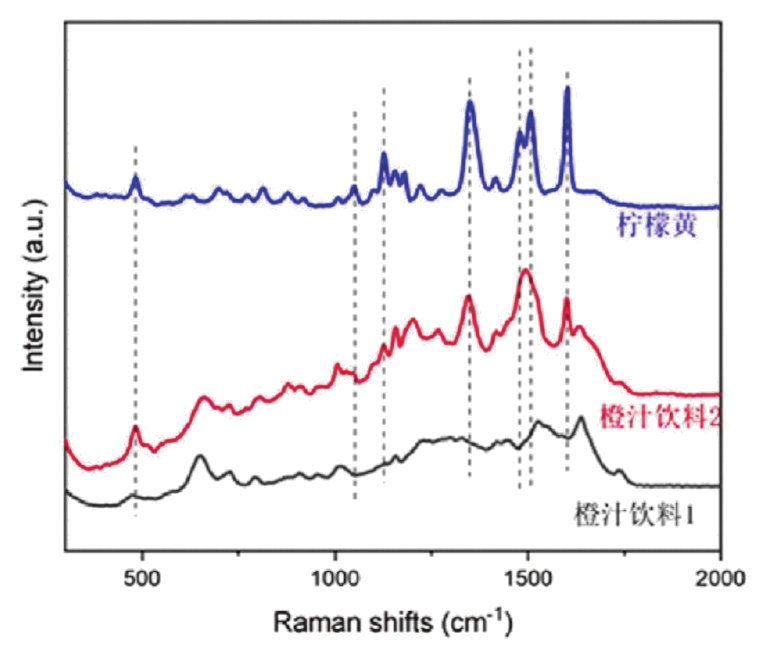
Figure: Raman spectra of pigments in beverages
Quantitative analysis
Quantitative Experiment: Ethanol Concentration Analysis
As the concentration decreases, the intensity of the characteristic Raman peaks of ethanol decreases in a regular pattern, providing practical training for quantitative analysis.
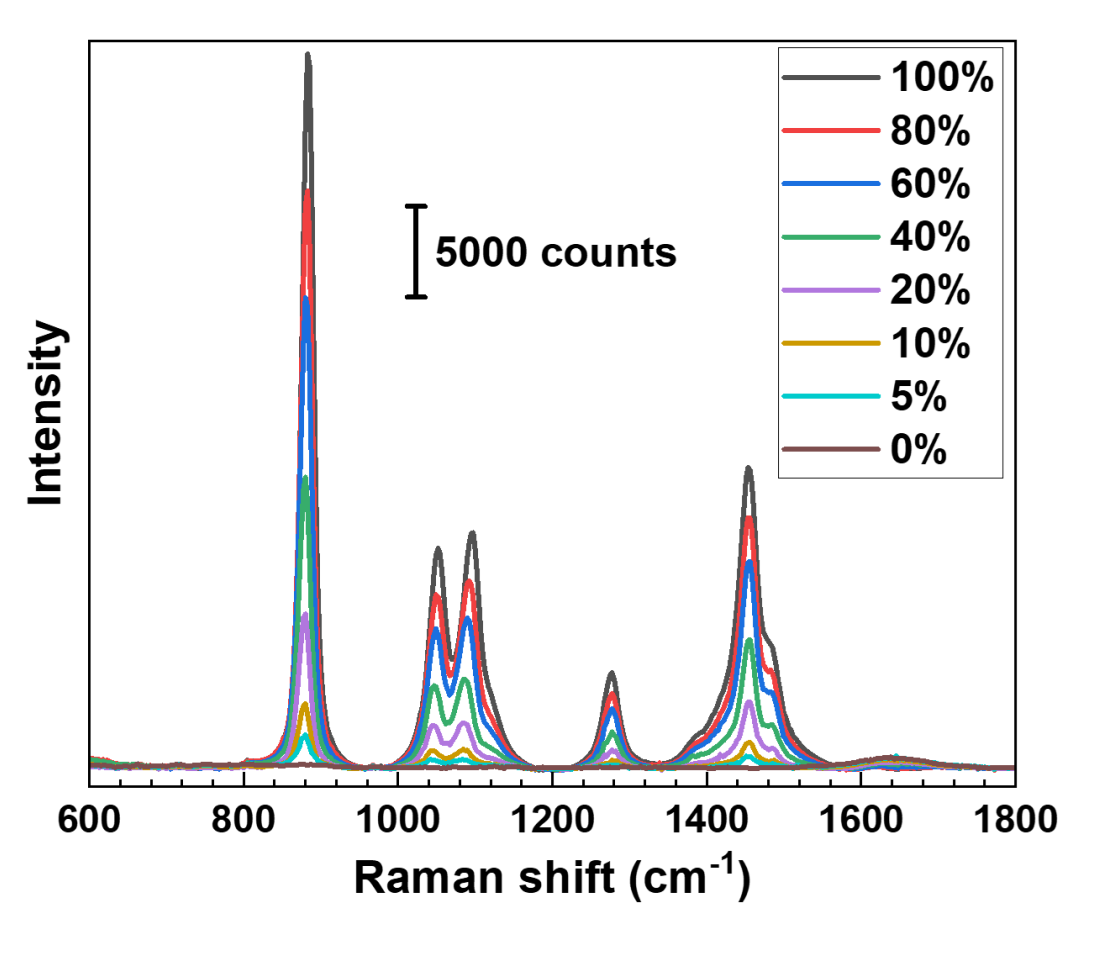
Figure: Raman spectra of ethanol solutions at different concentrations
Absorption spectroscopy
UV-Vis Absorption Measurement
Using the Educational Multifunctional Raman Spectroscopy System, students can complete a full UV-Vis absorption spectroscopy measurement experiment, gaining a deeper understanding of the light absorption characteristics of substances and their key role in the analysis of composition, concentration, and reaction processes.
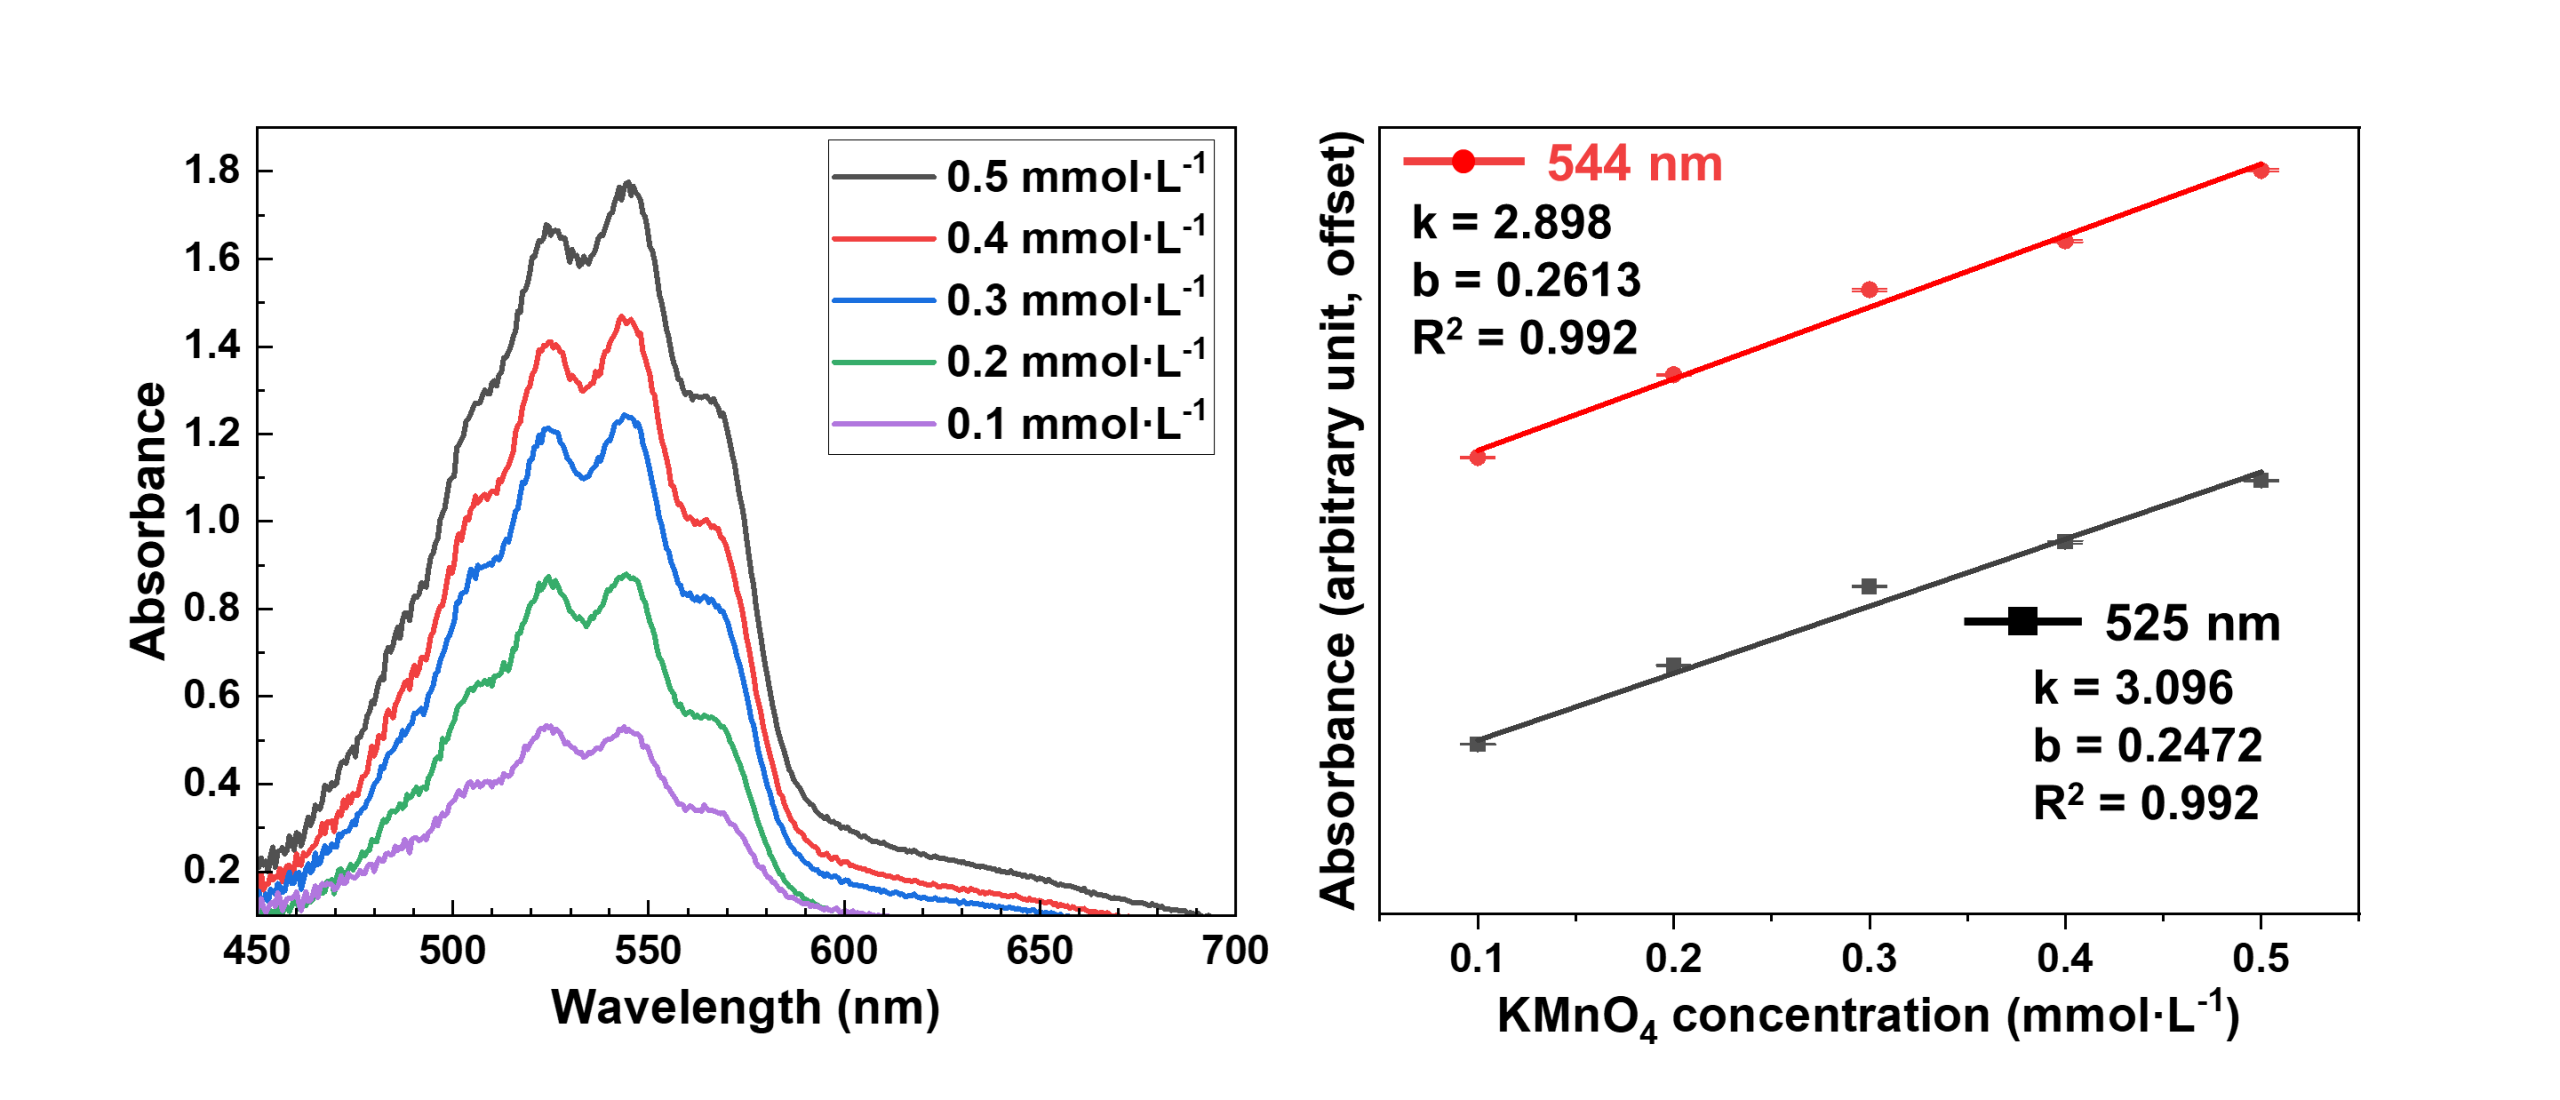
Figure 1: Absorption spectra of permanganate solutions at different concentrations
Figure 2: Fluorescence spectra of resazurin at different concentrations
Fluorescence
Resazurin at Nanomolar Concentrations
Using the Educational Multifunctional Raman Spectroscopy System, students can complete a quantitative analysis experiment of resazurin at nanomolar concentrations, gaining a deeper understanding of the linear relationship between fluorescence intensity and concentration, as well as the principles of trace-level detection.
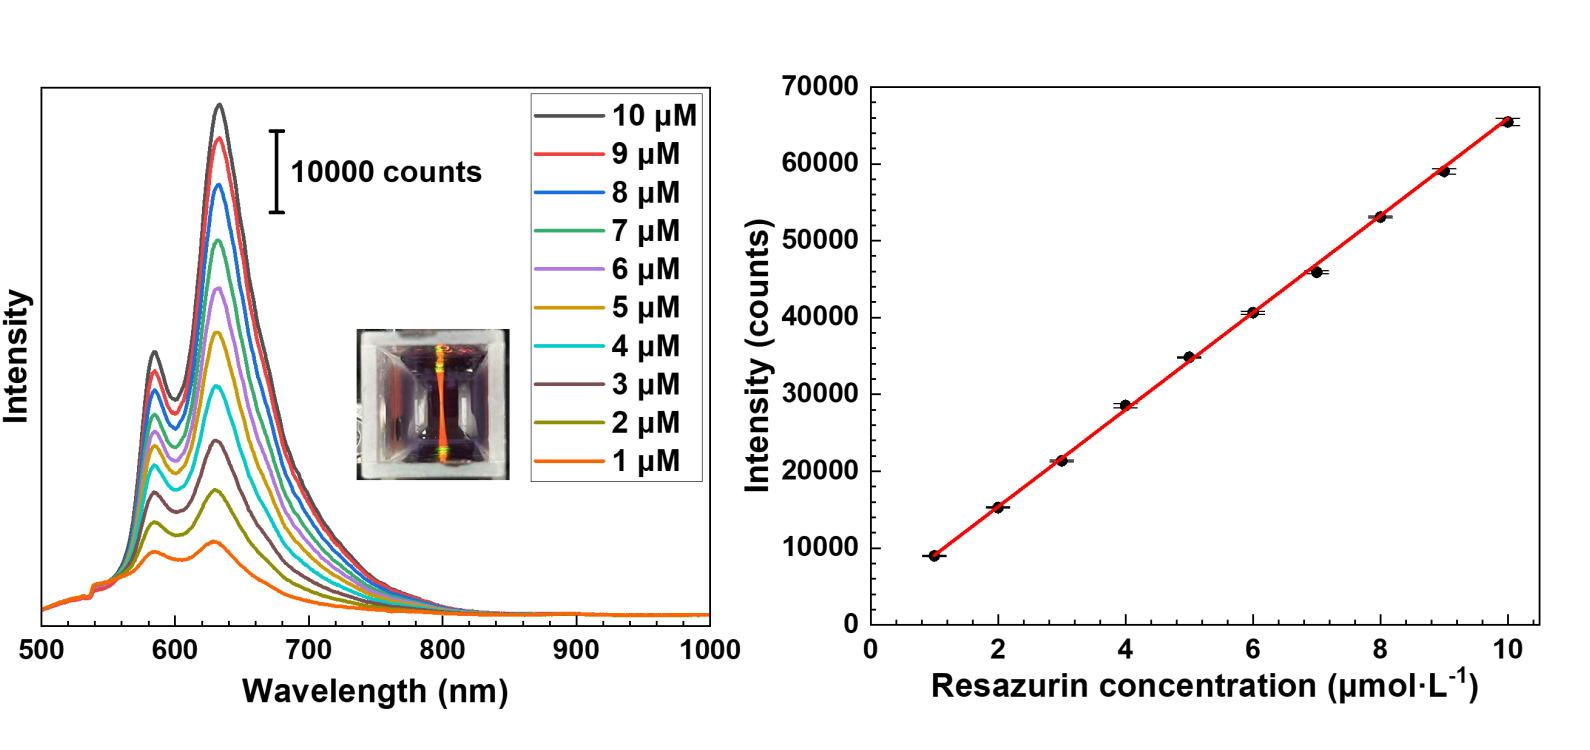
Figure 1 : Fluorescence spectra of resazurin at different concentrations
Figure 2: Linear relationship between absorbance and concentration
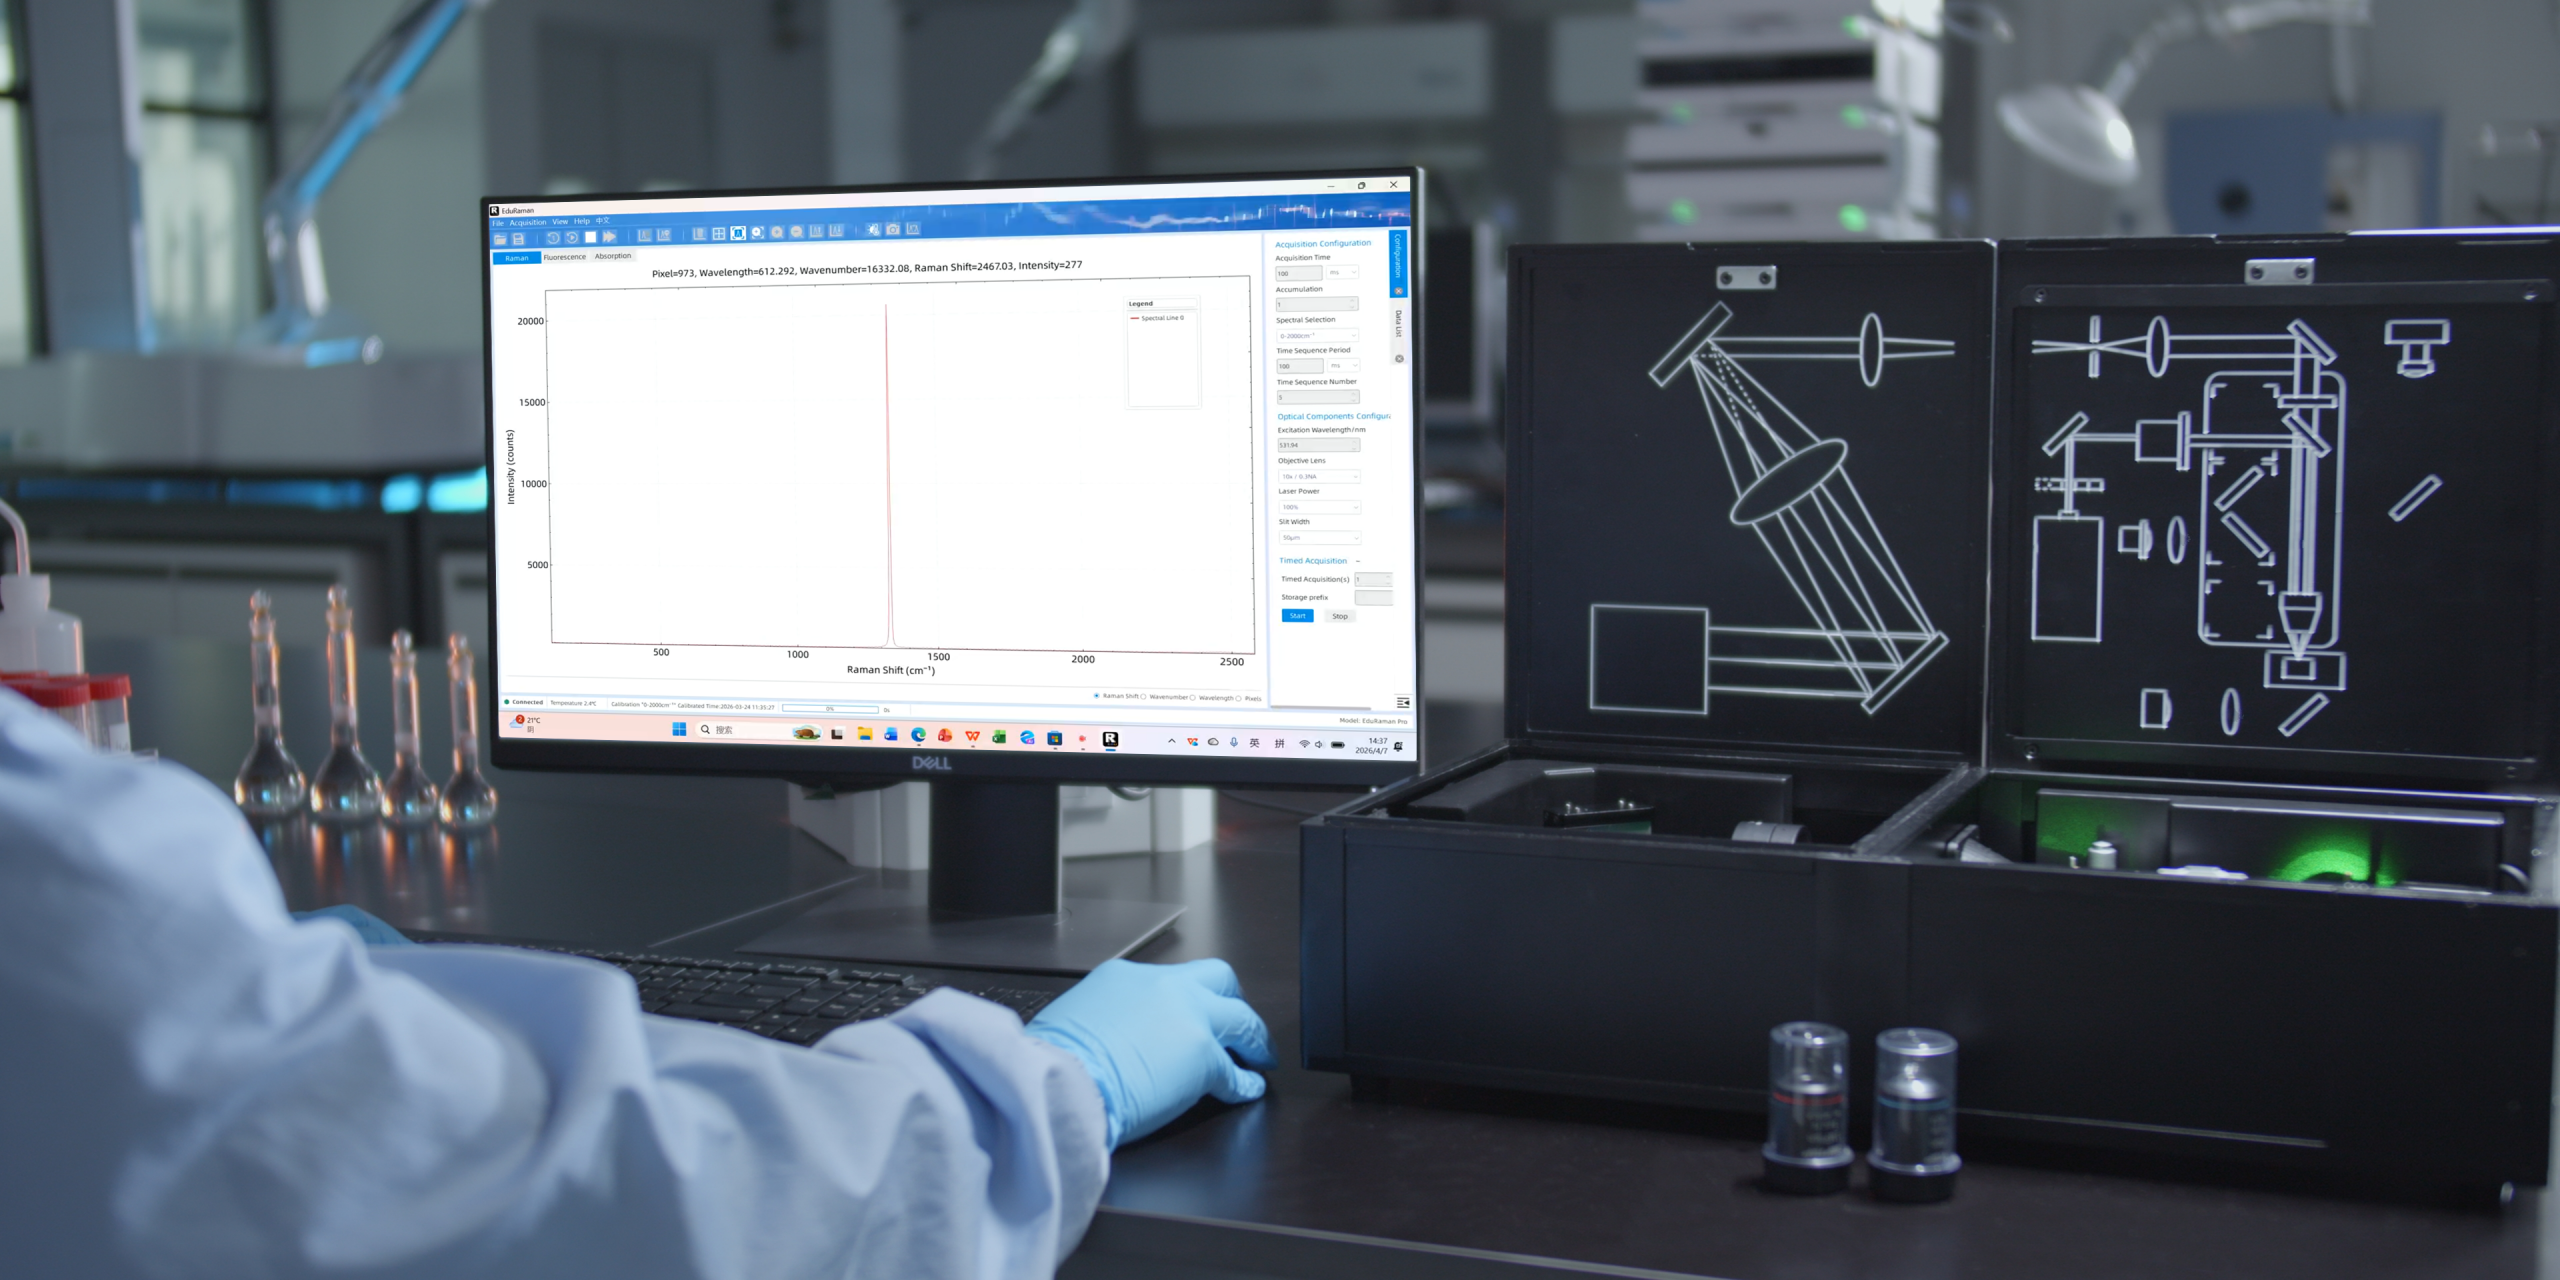
EduRaman Pro Software EduRaman Pro Software EduRaman Pro Software
One software. Multiple spectroscopy techniques.
- EduRaman Pro Software provides an intuitive environment for instrument control, spectral acquisition, microscopic imaging and data analysis.
- Intuitive principle demonstration — Visualize calibration and instrument principles.
- Data collection and management;
- Multifunctional acquisition & imaging — Combine spectral measurements with microscopic visualization.
- Built-in knowledge search — Access spectroscopy terminology and learning resources.
- One-click switching — Move between Raman, imaging, absorption and fluorescence workflows from one
Brochures & Manuals Brochures & Manuals Brochures & Manuals
Please, enter your Full Name & Email to unlock downloads or log in to your account.